IMAGES FROM CHAPTER 3
please check gray text for attribution and licensing restrictions
images in copyright are not available for download

| FIGURE 3.1 |
| One-kilometer artillery grid on a French trench map, Moreuil, 5 Aug 1918 | |
| Service Géographique de l’Armée Public Domain: copyright expired | |

| FIGURE 3.2 |
| Universal Transverse Mercator grid on a US topographic map, Solomons Island, 1987 | |
| US Geological Survey Public Domain: US government | |

| FIGURE 3.3 |
| Detail from the French carte de l’État major, 1885 | |
| Dépôt de la Guerre Public Domain: copyright expired | |

| FIGURE 3.4 |
| The Bonne projection used for the carte de l’État major, extended to show the entire world | |
| William Rankin Creative Commons BY-NC-SA | |
| FIGURE 3.5 |
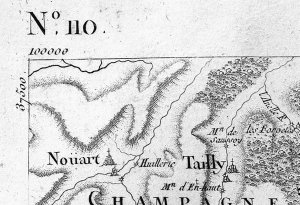
| Sheet corner from Cassini's Carte de France, Verdun, 1760 | |
| César-François Cassini de Thury Public Domain: copyright expired | |
| FIGURE 3.6 |
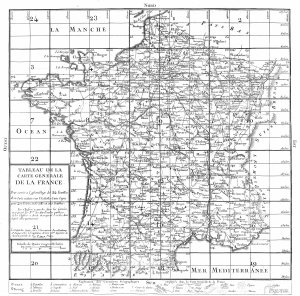
| Index sheet from Cassini's Carte de France, 1797 | |
| César-François Cassini de Thury Public Domain: copyright expired | |
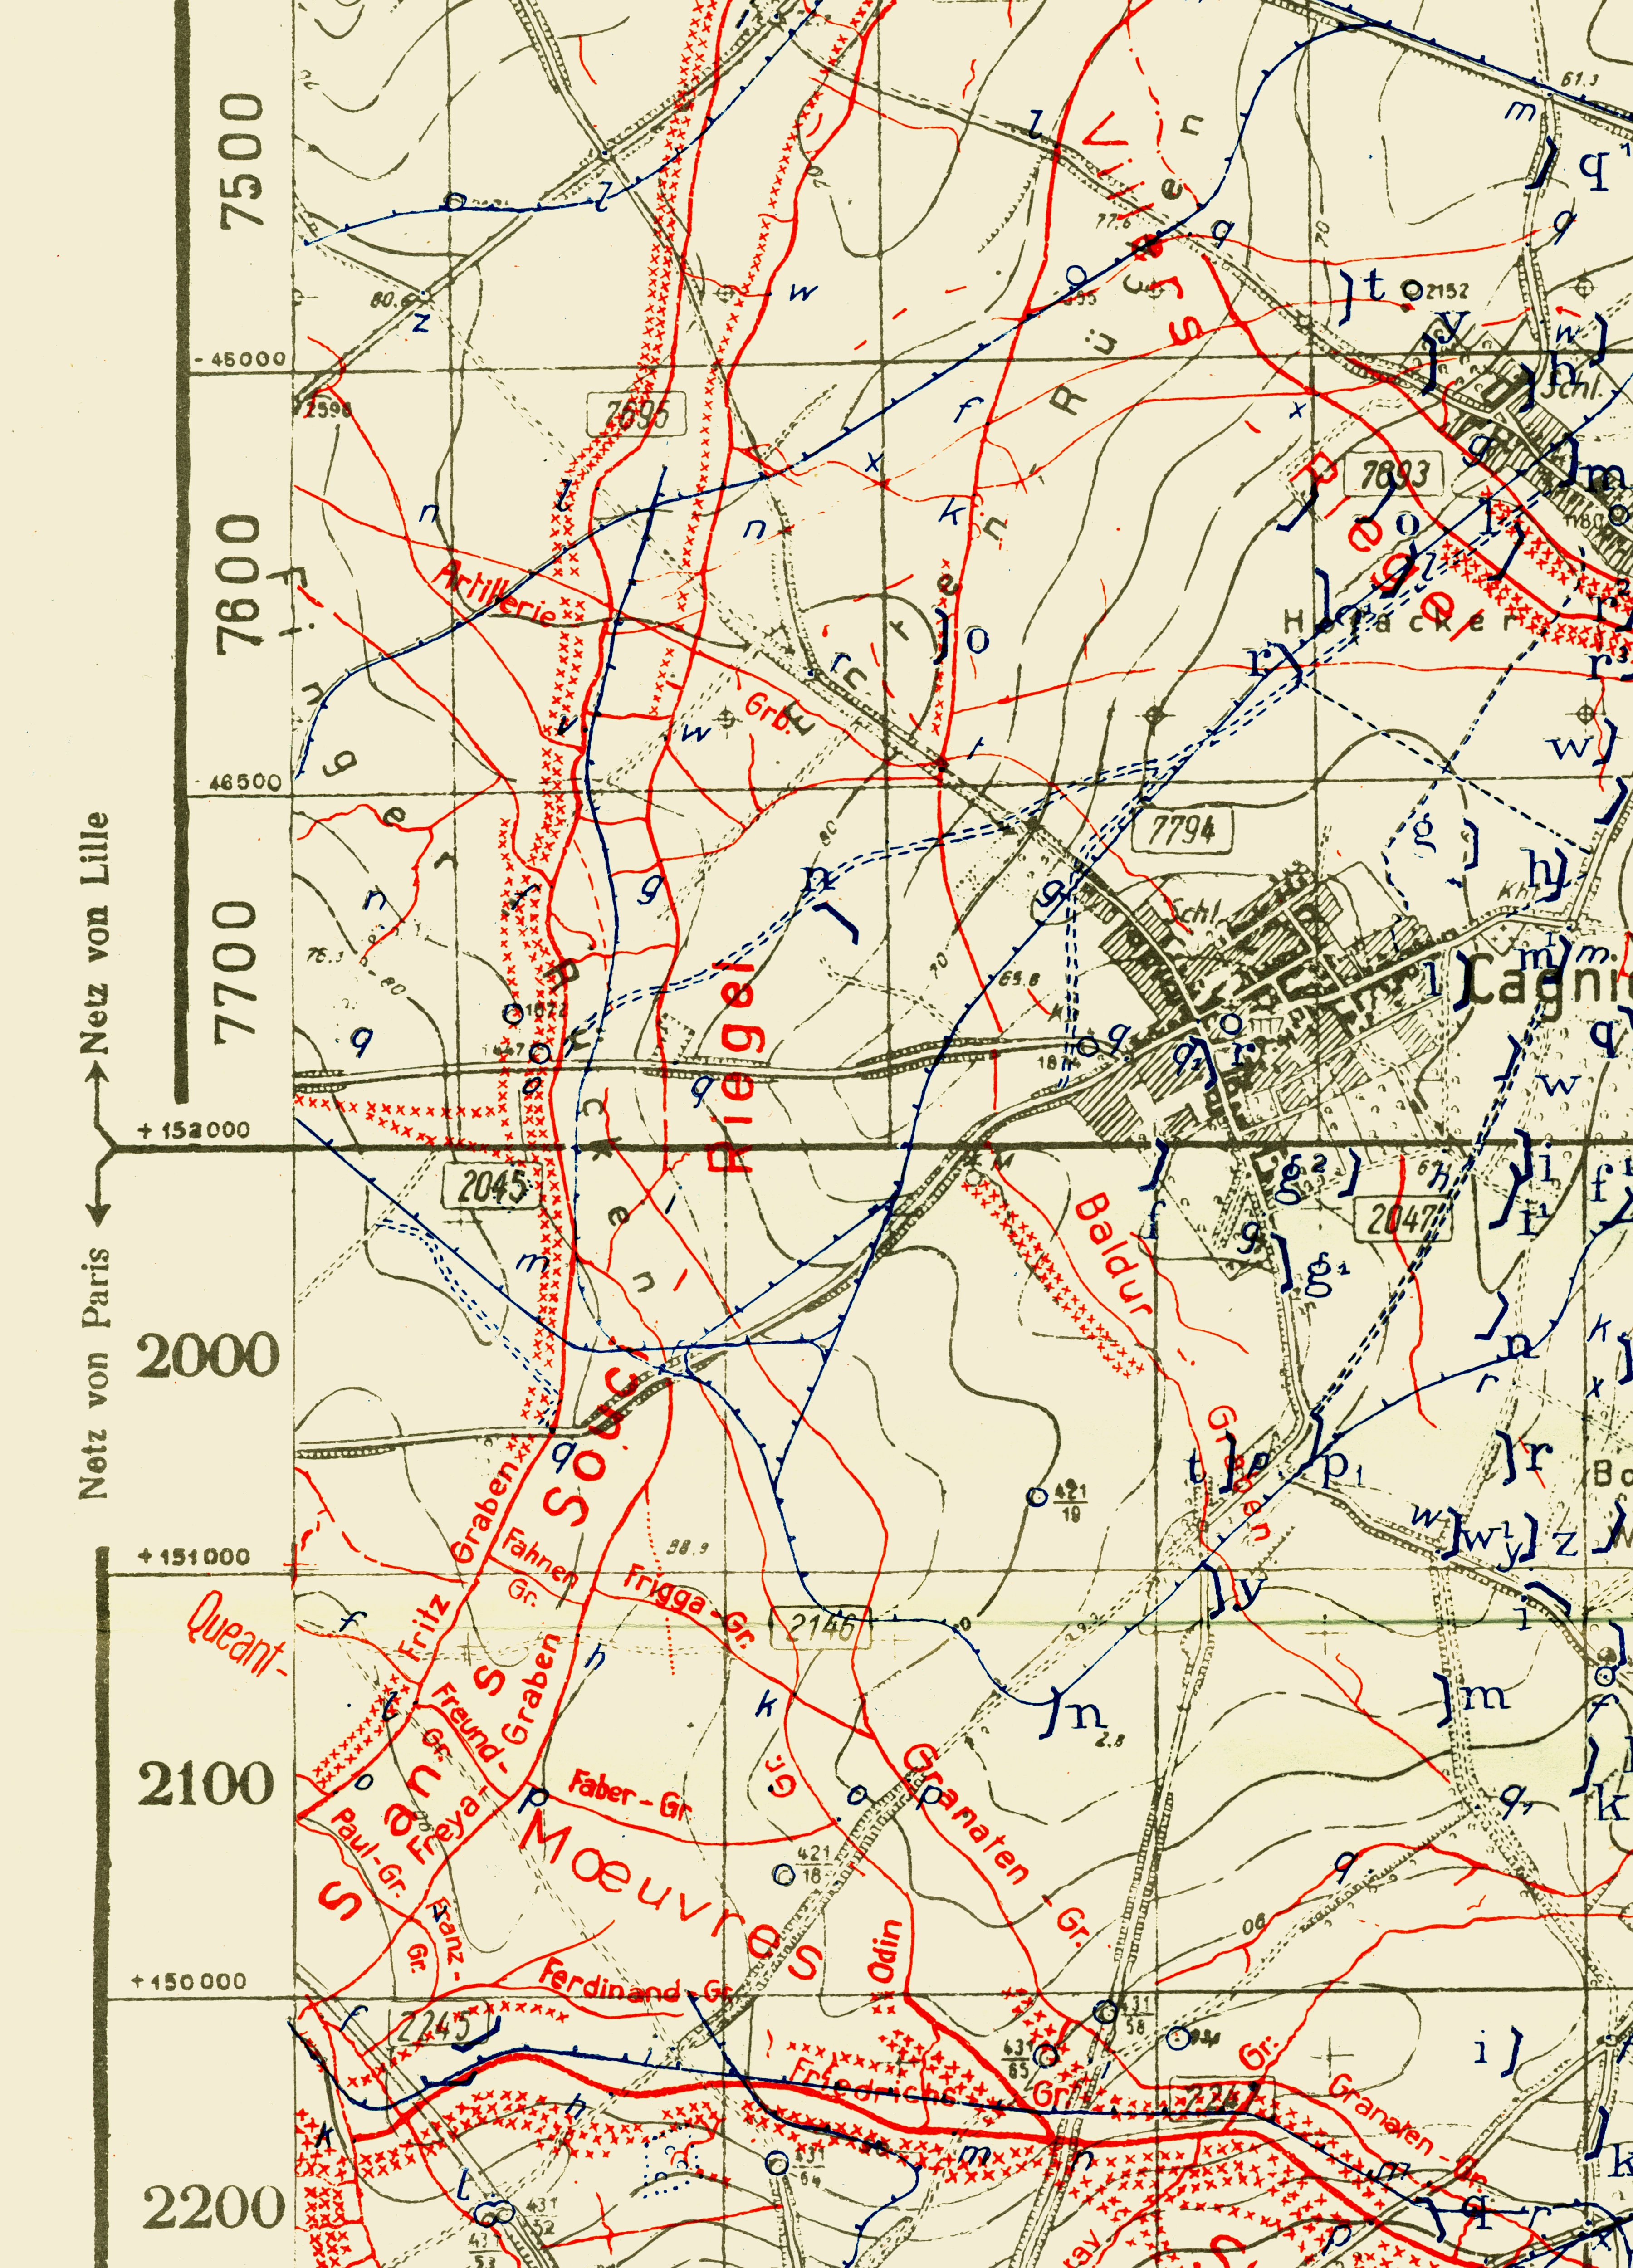
| FIGURE 3.7 |
| Grid junctions on a German trench Map, Bourlon, 18 Sep 1918 | |
| reproduced in Oskar Albrecht, Das Kriegsvermessungswesen während des Weltkrieges 1914–18 (München: Bayerische Akademie der Wissenschaften, 1969) Public Domain: copyright expired | |
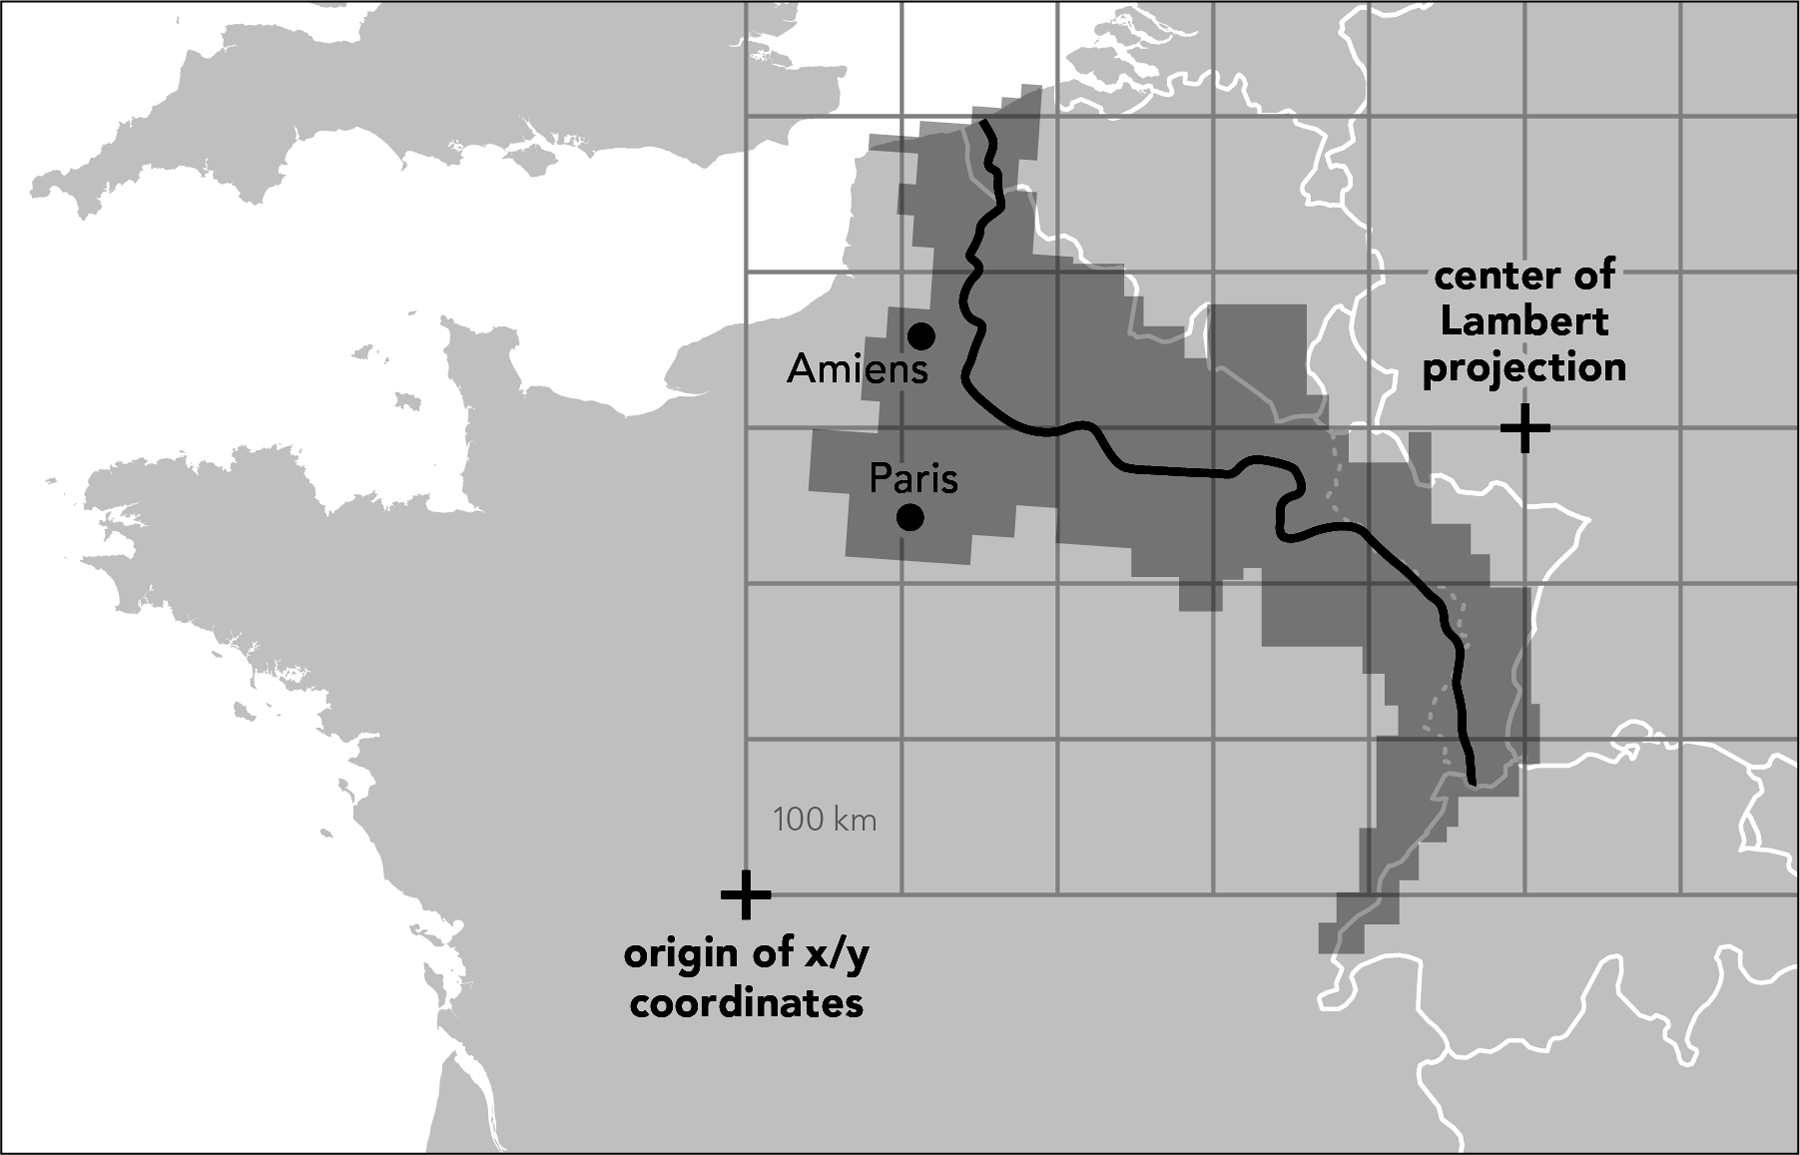
| FIGURE 3.8 |
| Deployment of the French système Lambert map grid along the western front | |
| William Rankin Creative Commons BY-NC-SA | |
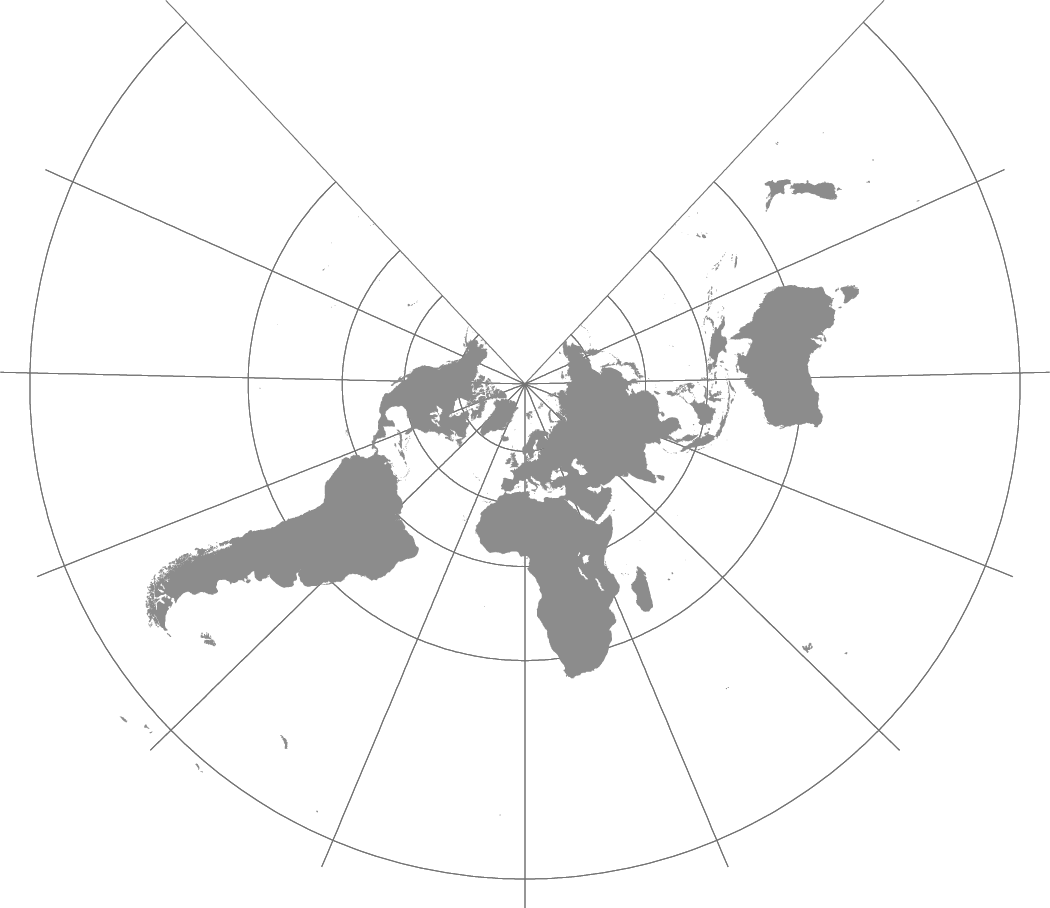
| FIGURE 3.9 |
| The Lambert projection used for the système Lambert, extended to show the entire world | |
| William Rankin Creative Commons BY-NC-SA | |

| FIGURE 3.10 |
| Page from a French trig list, April 1917, giving grid coordinates | |
| Service Géographique de l’Armée; reproduced in Peter Chasseaud, Artillery’s Astrologers: A History of British Survey & Mapping on the Western Front, 1914–1918 (Lewes: Mapbooks, 1999), 514 Public Domain: copyright expired | |
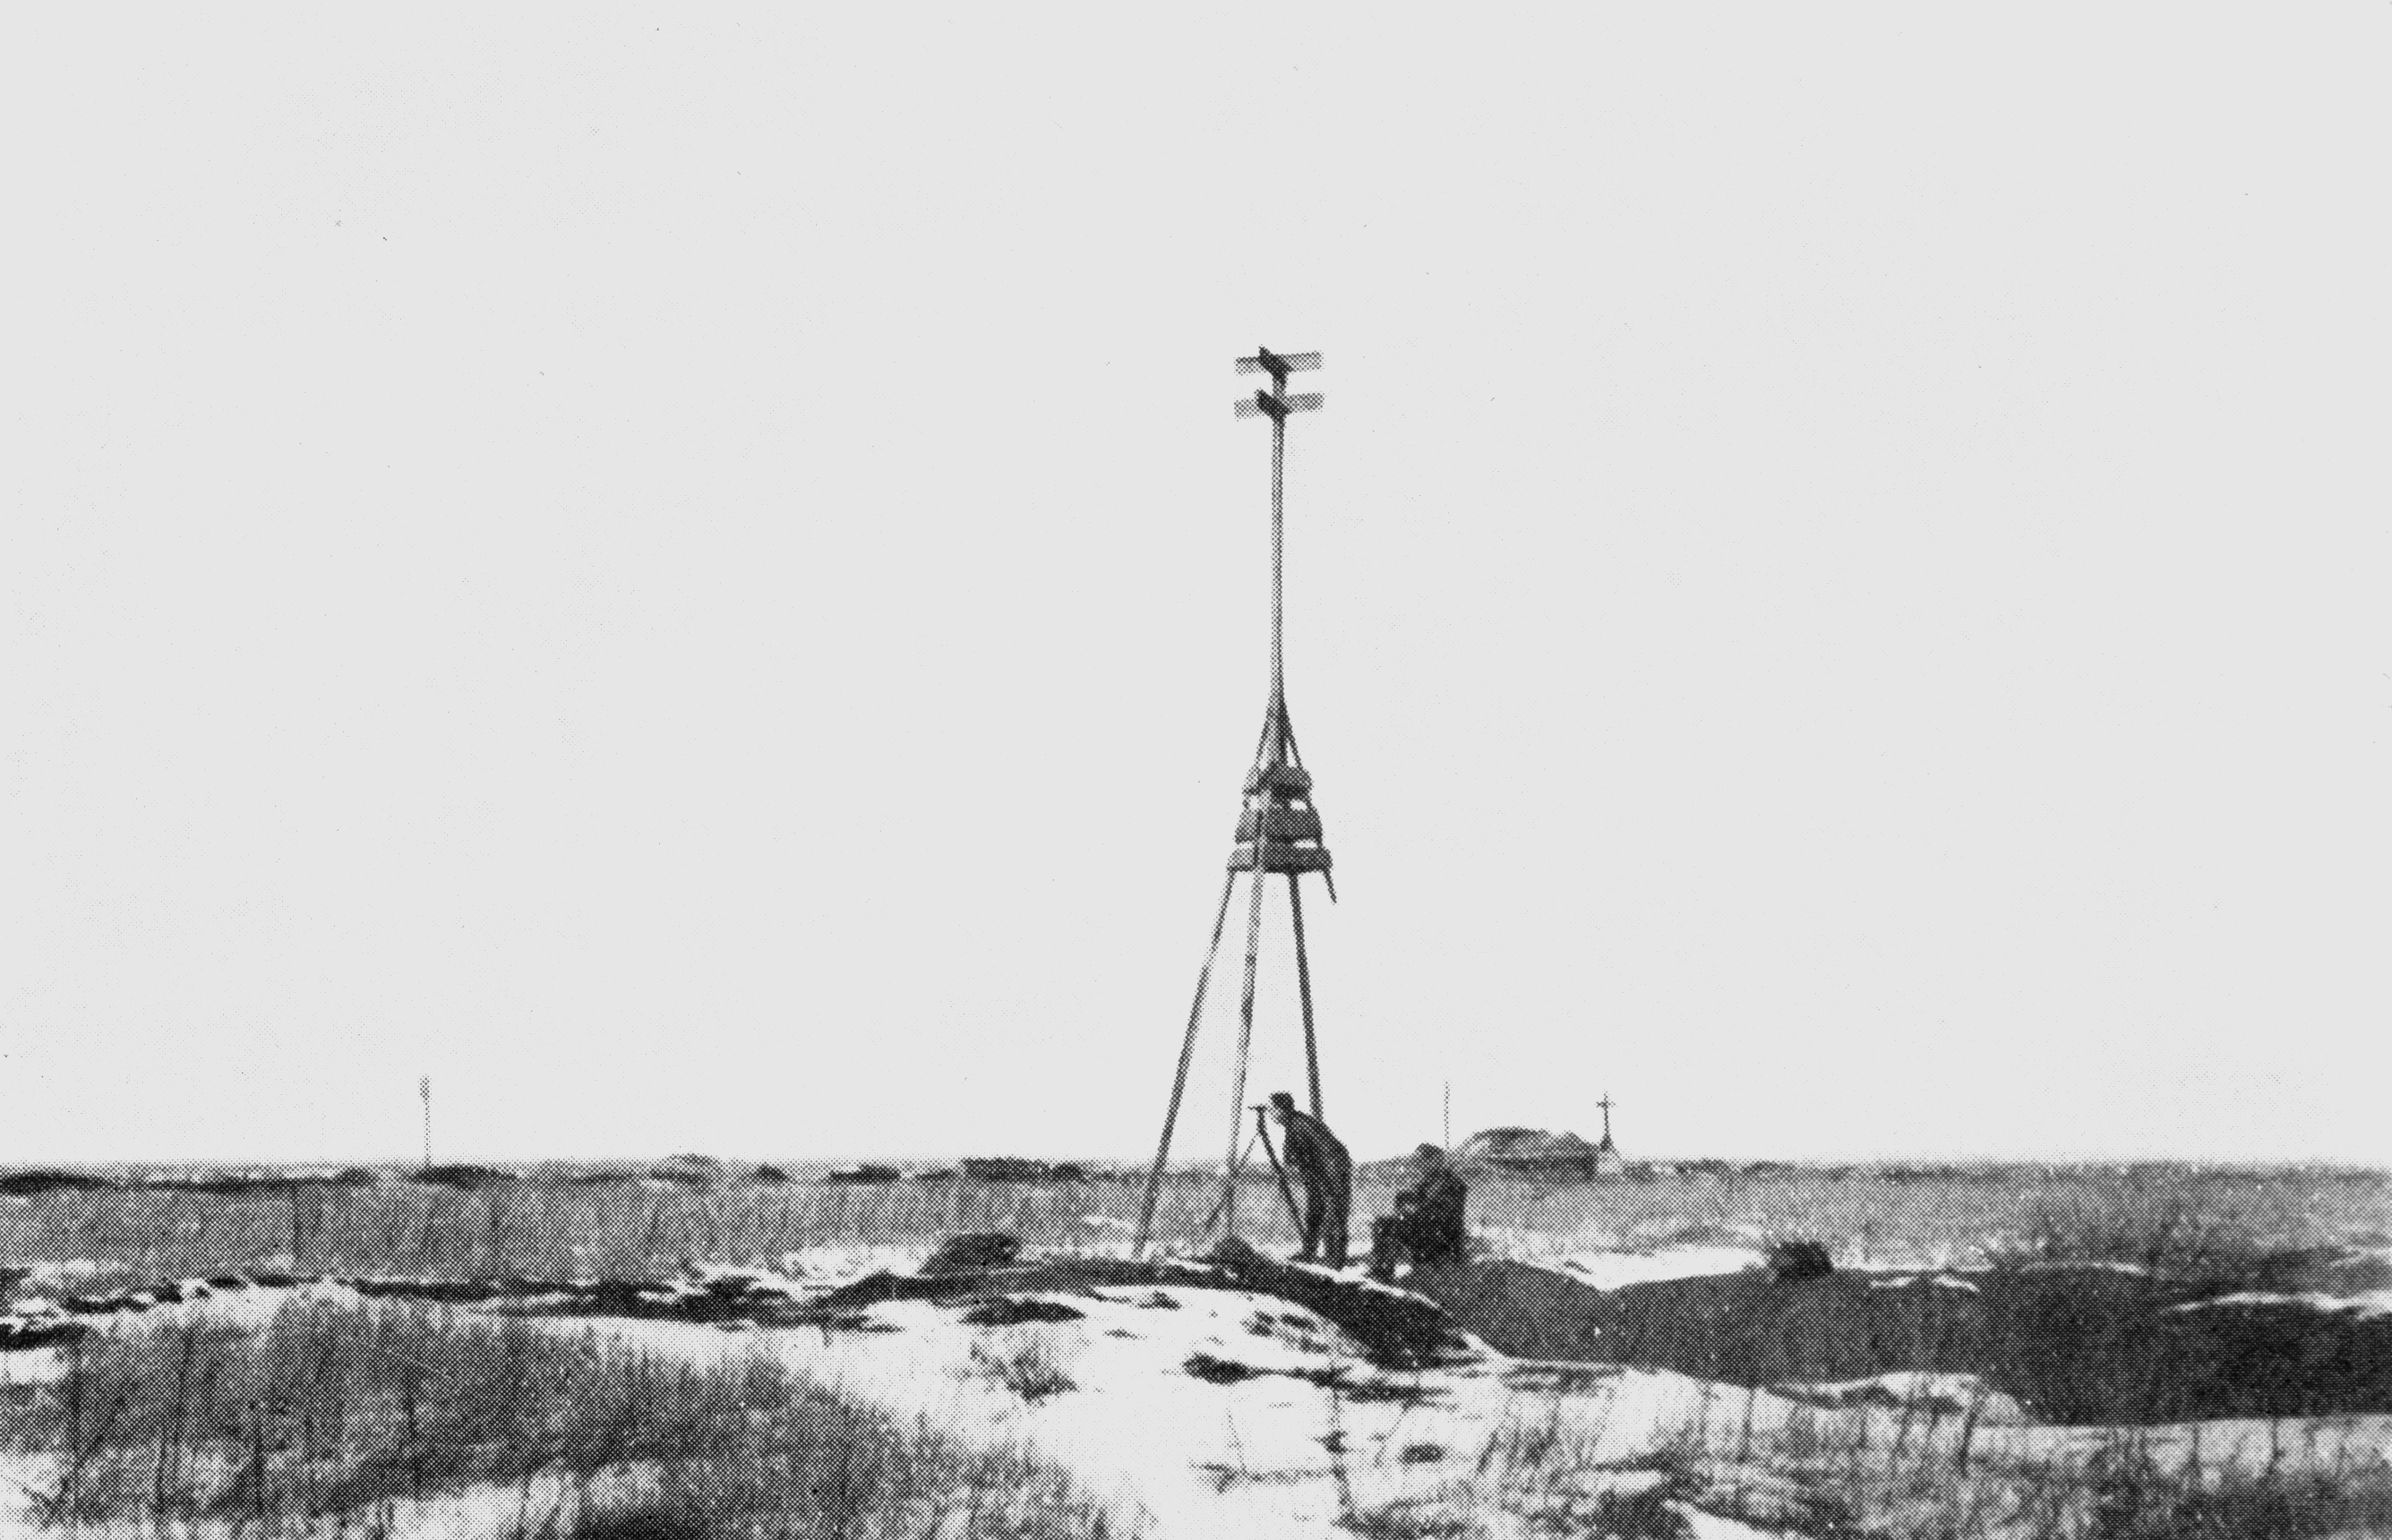
| FIGURE 3.11 |
| British surveyors measuring a captured German trig beacon during World War I | |
| from H. Winterbotham, “Geographical Work with the Army in France,” The Geographical Journal 54 (July 1919), 13 Public Domain: copyright expired | |
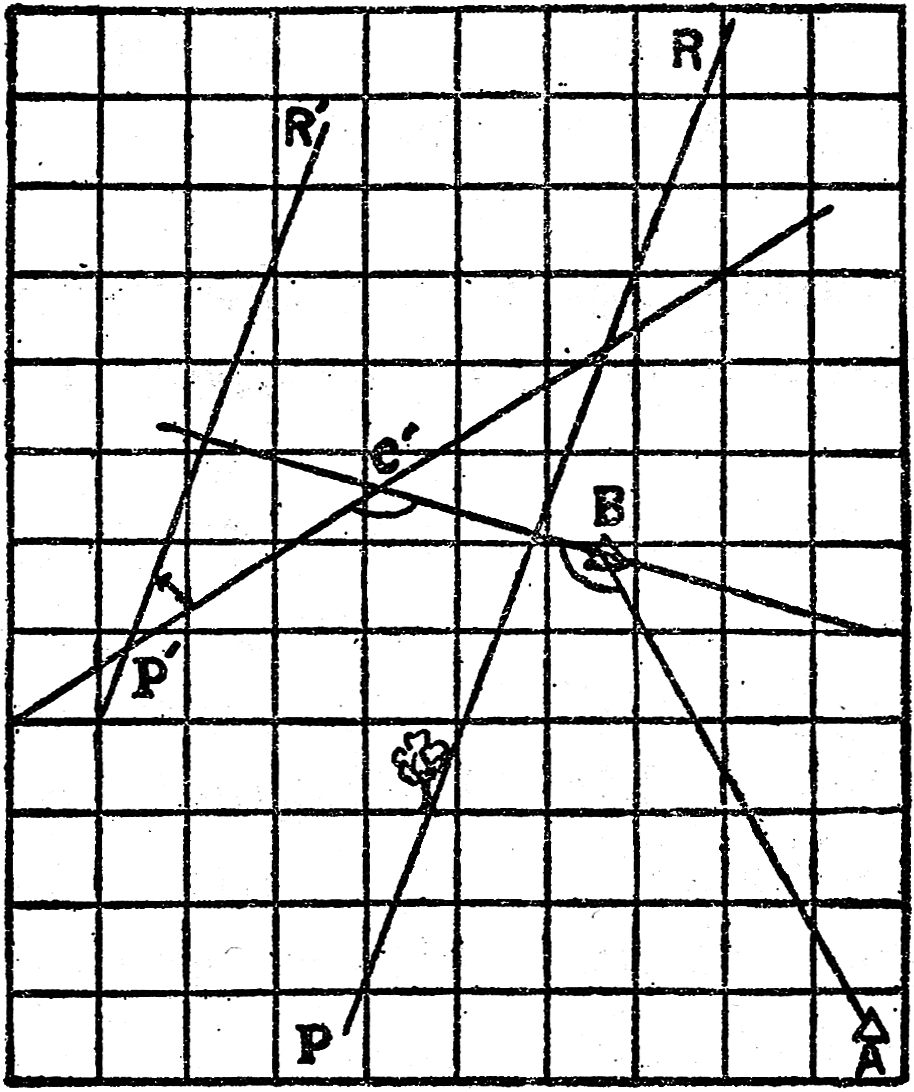
| FIGURE 3.12 |
| Textbook demonstration of how to plot a target on a plotting board | |
| from Manual for the Artillery Orientation Officer [translated from French original] (Washington DC: USGPO, 1917), 100 Public Domain: copyright expired | |
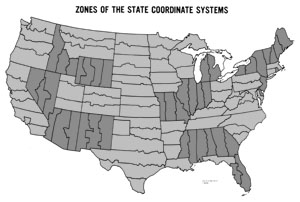
| FIGURE 3.13 |
| Zones of the US State Plane Coordinate System, with a separate grid system for each zone | |
| Surveying and Mapping Copyright 1967 | |
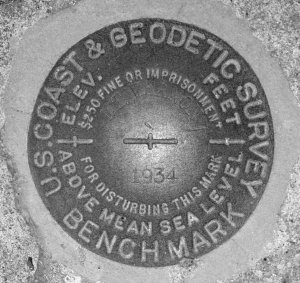
| FIGURE 3.14 |
| Survey monument in Mt. Vernon, Texas, placed in 1934 | |
| QuesterMark Creative Commons BY-SA | |

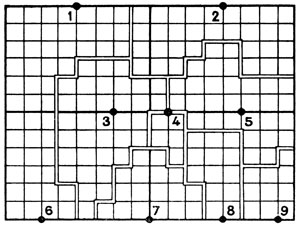
| FIGURE 3.15 |
| Henri Roussilhe’s scheme for an international grid system, 1922 | |
| from H. Roussilhe, “Emploi des coordonnées rectangulaires stéréographiques pour le calcul de la triangulation dans un rayon de 560 kilomètres autour de l’origine,” Travaux de l’Association internationale de géodésie 1 (Paris, 1923 [presented 1922]); shading added Public Domain: copyright expired | |

| FIGURE 3.16 |
| Historical values for the size and shape of the earth download data in a spreadsheet | |
| William Rankin Creative Commons BY-NC-SA | |
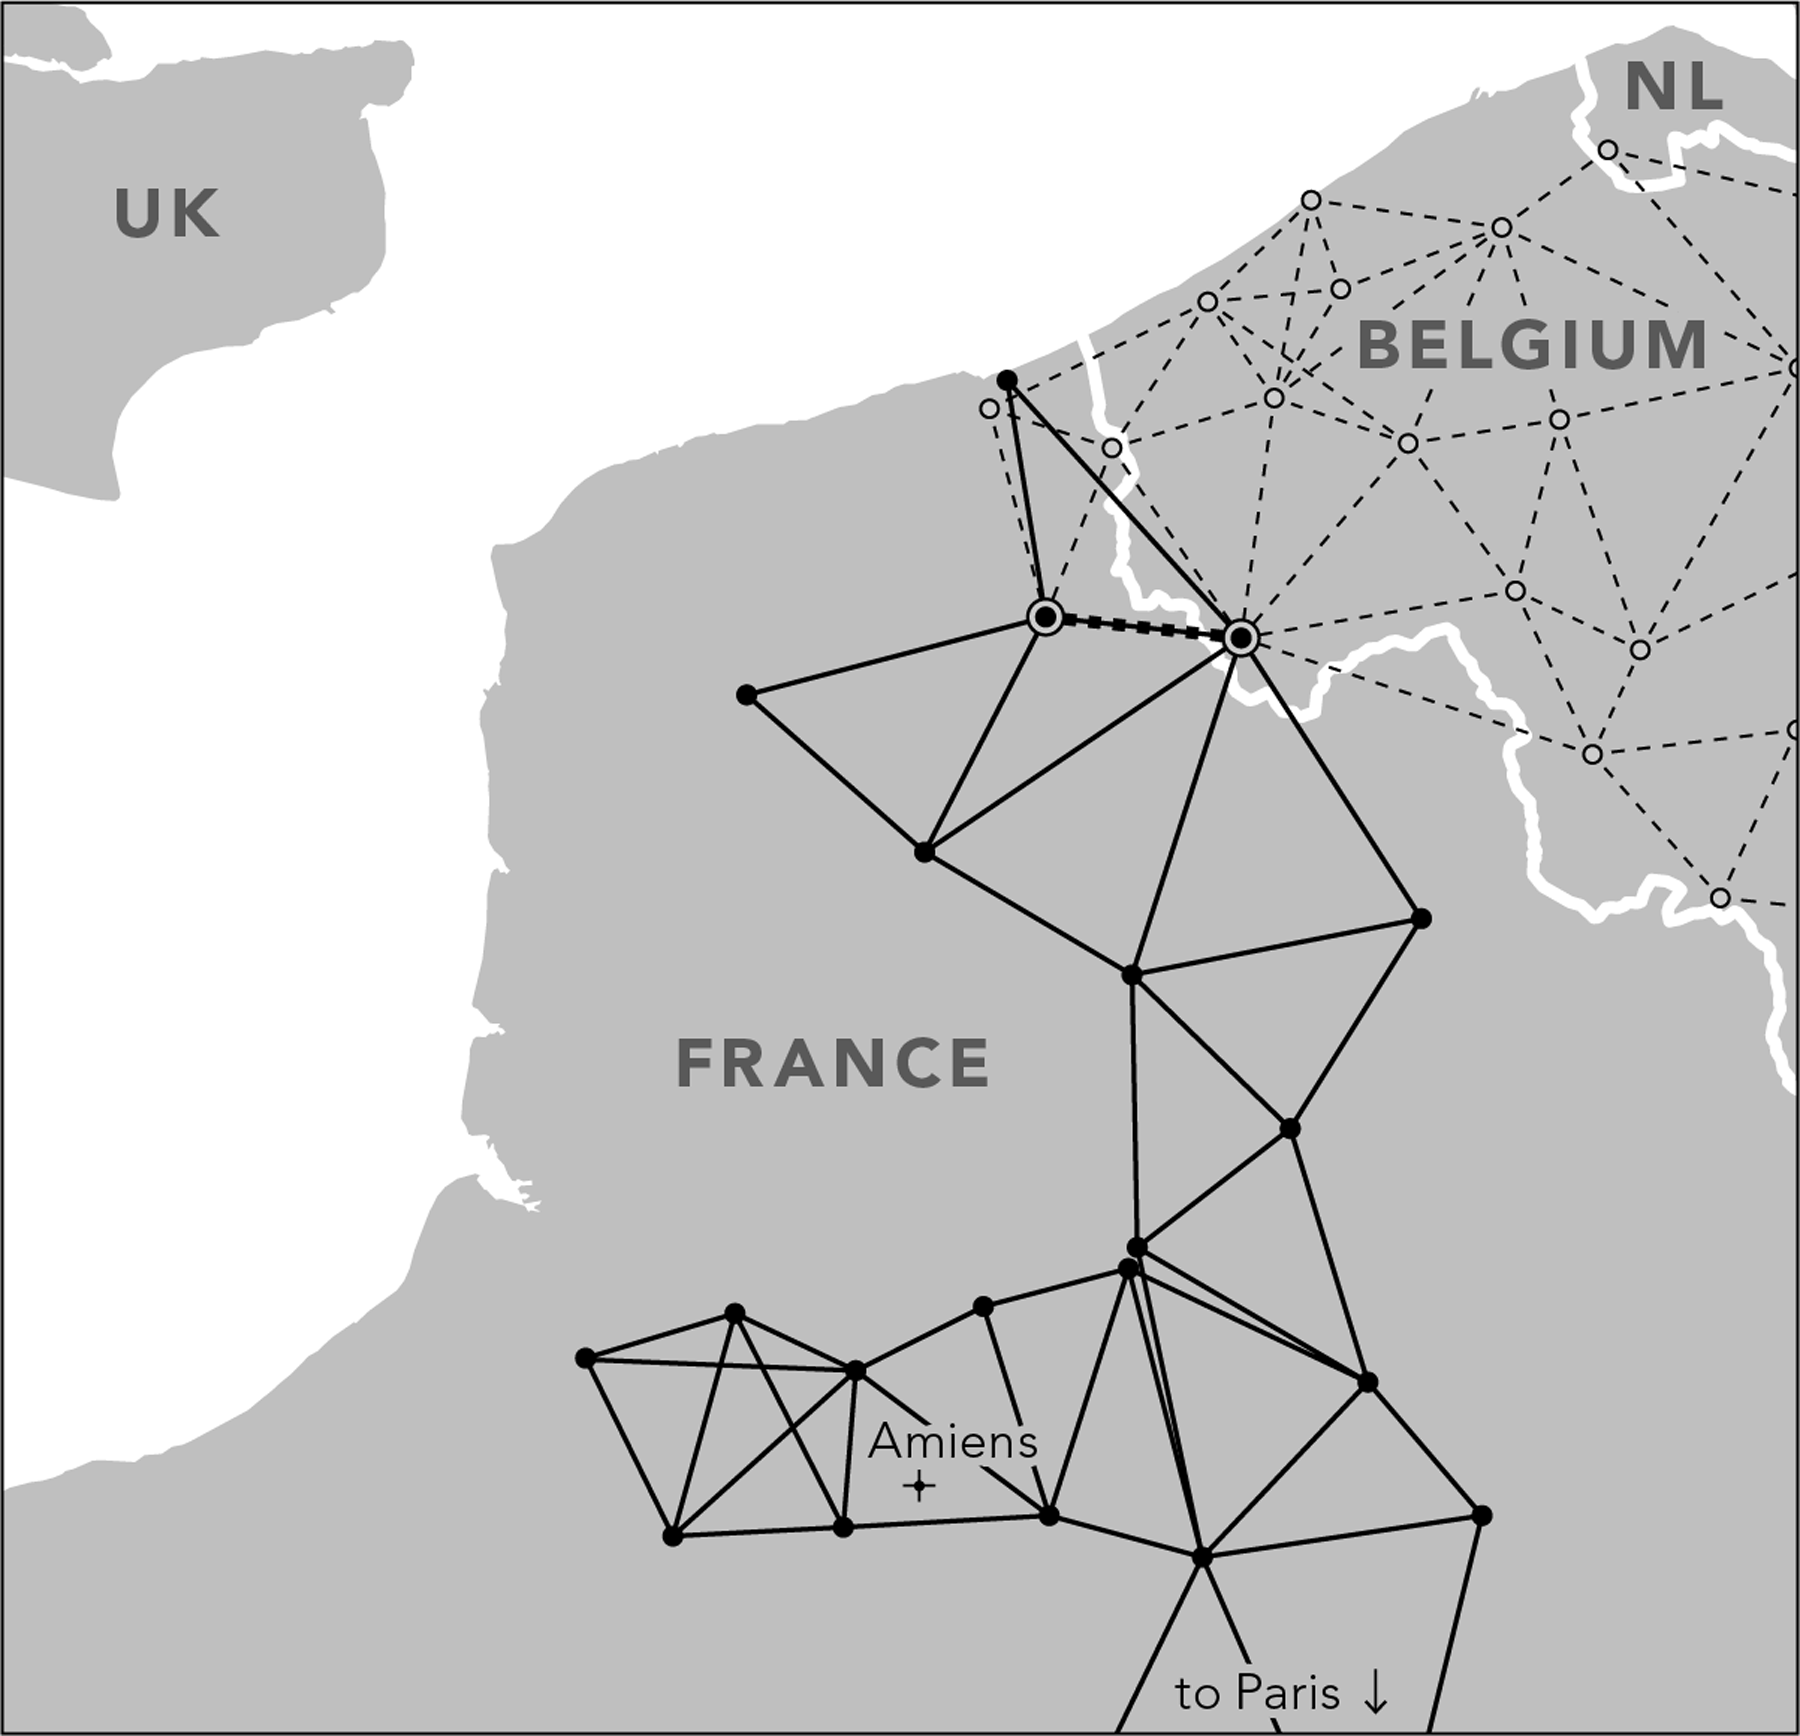
| FIGURE 3.17 |
| The junction of the French and Belgian national triangulations as of 1920 | |
| William Rankin Creative Commons BY-NC-SA | |
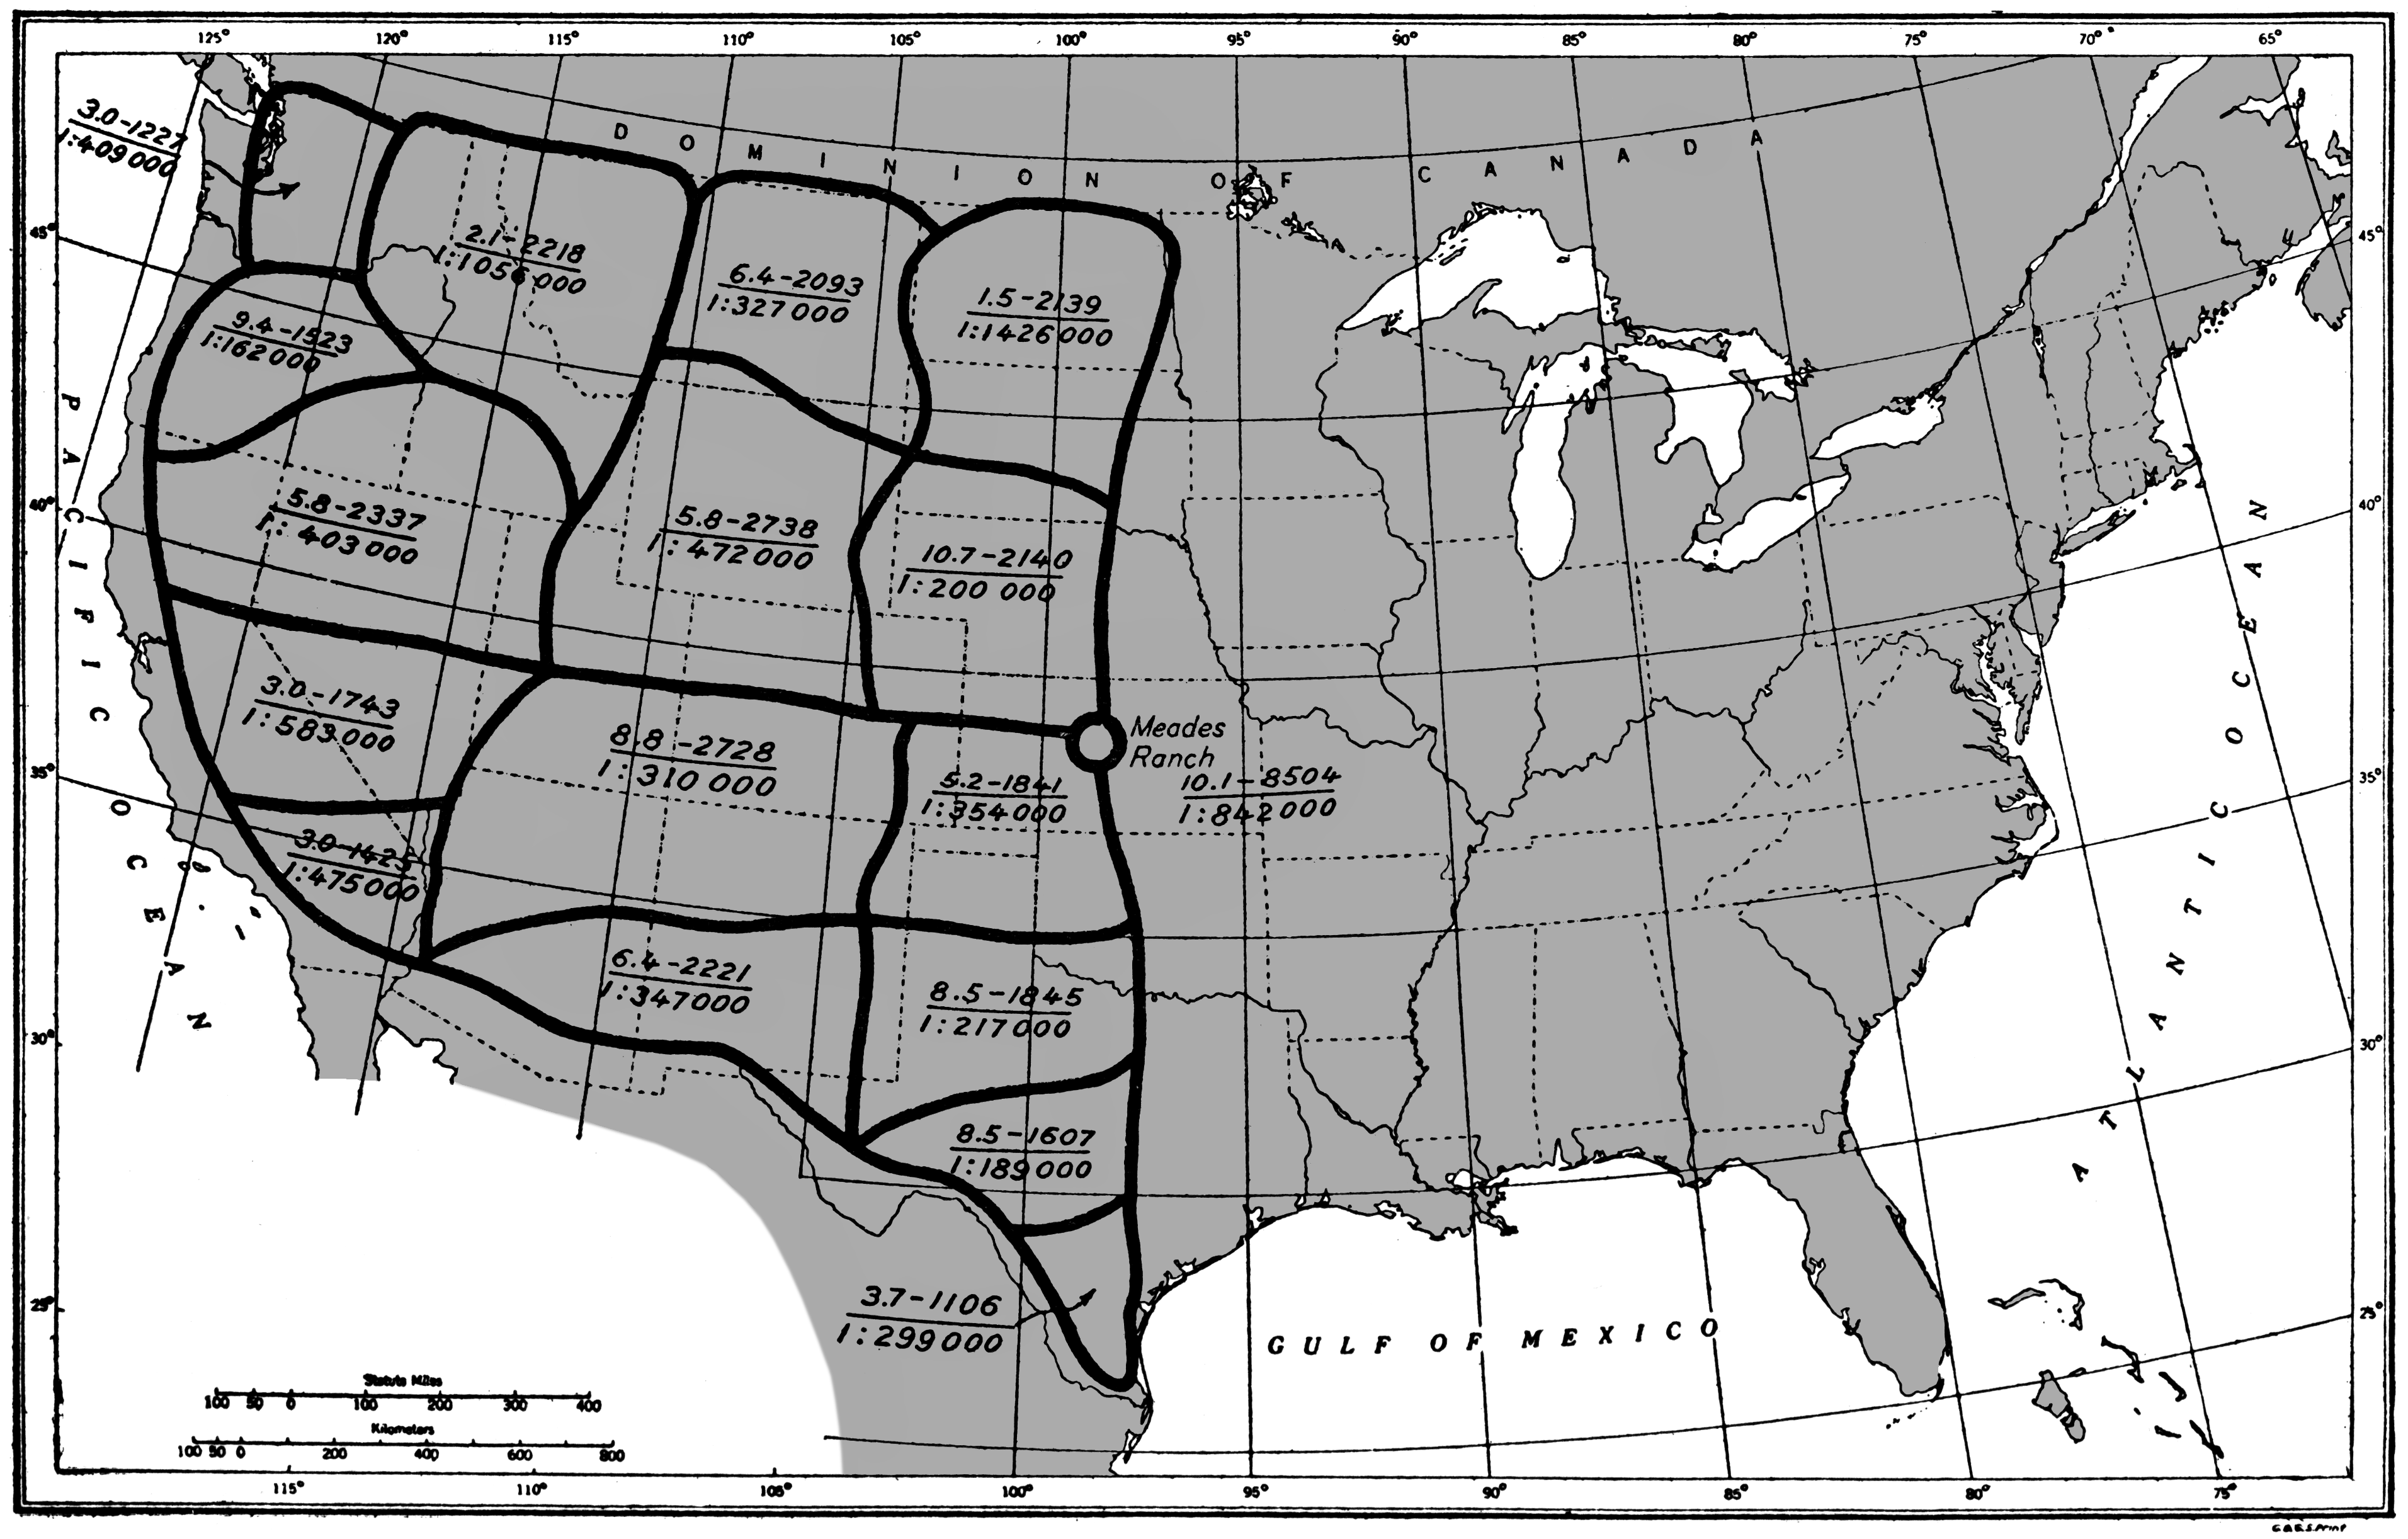
| FIGURE 3.18 |
| The use of computationally efficient “Bowie Loops” in the western United States | |
| from Oscar Adams, The Bowie Method of Triangulation Adjustment, US Coast and Geodetic Survey special publication 159 (Washington, DC: USGPO, 1930), 10; shading added Public Domain: US government | |
| FIGURE 3.19 |
| Schematic plan for the recalculation of the European triangulation network, 1939 | |
| Bulletin géodésique Copyright 1939 | |
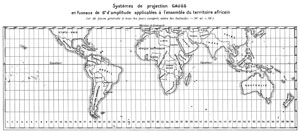
| FIGURE 3.20 |
| Pierre Tardi's plan for a grid system for Africa, 1936 | |
| Bulletin géodésique Copyright 1938 | |
| continue to chapter 4 . . . | |