IMAGES FROM CHAPTER 5
please check gray text for attribution and licensing restrictions
images in copyright are not available for download
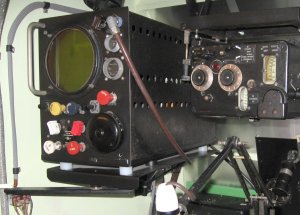
| FIGURE 5.1 |
| Mockup of a Gee receiver in an Avro Lancaster bomber | |
| photo by Peter Zijlstra used with permission | |
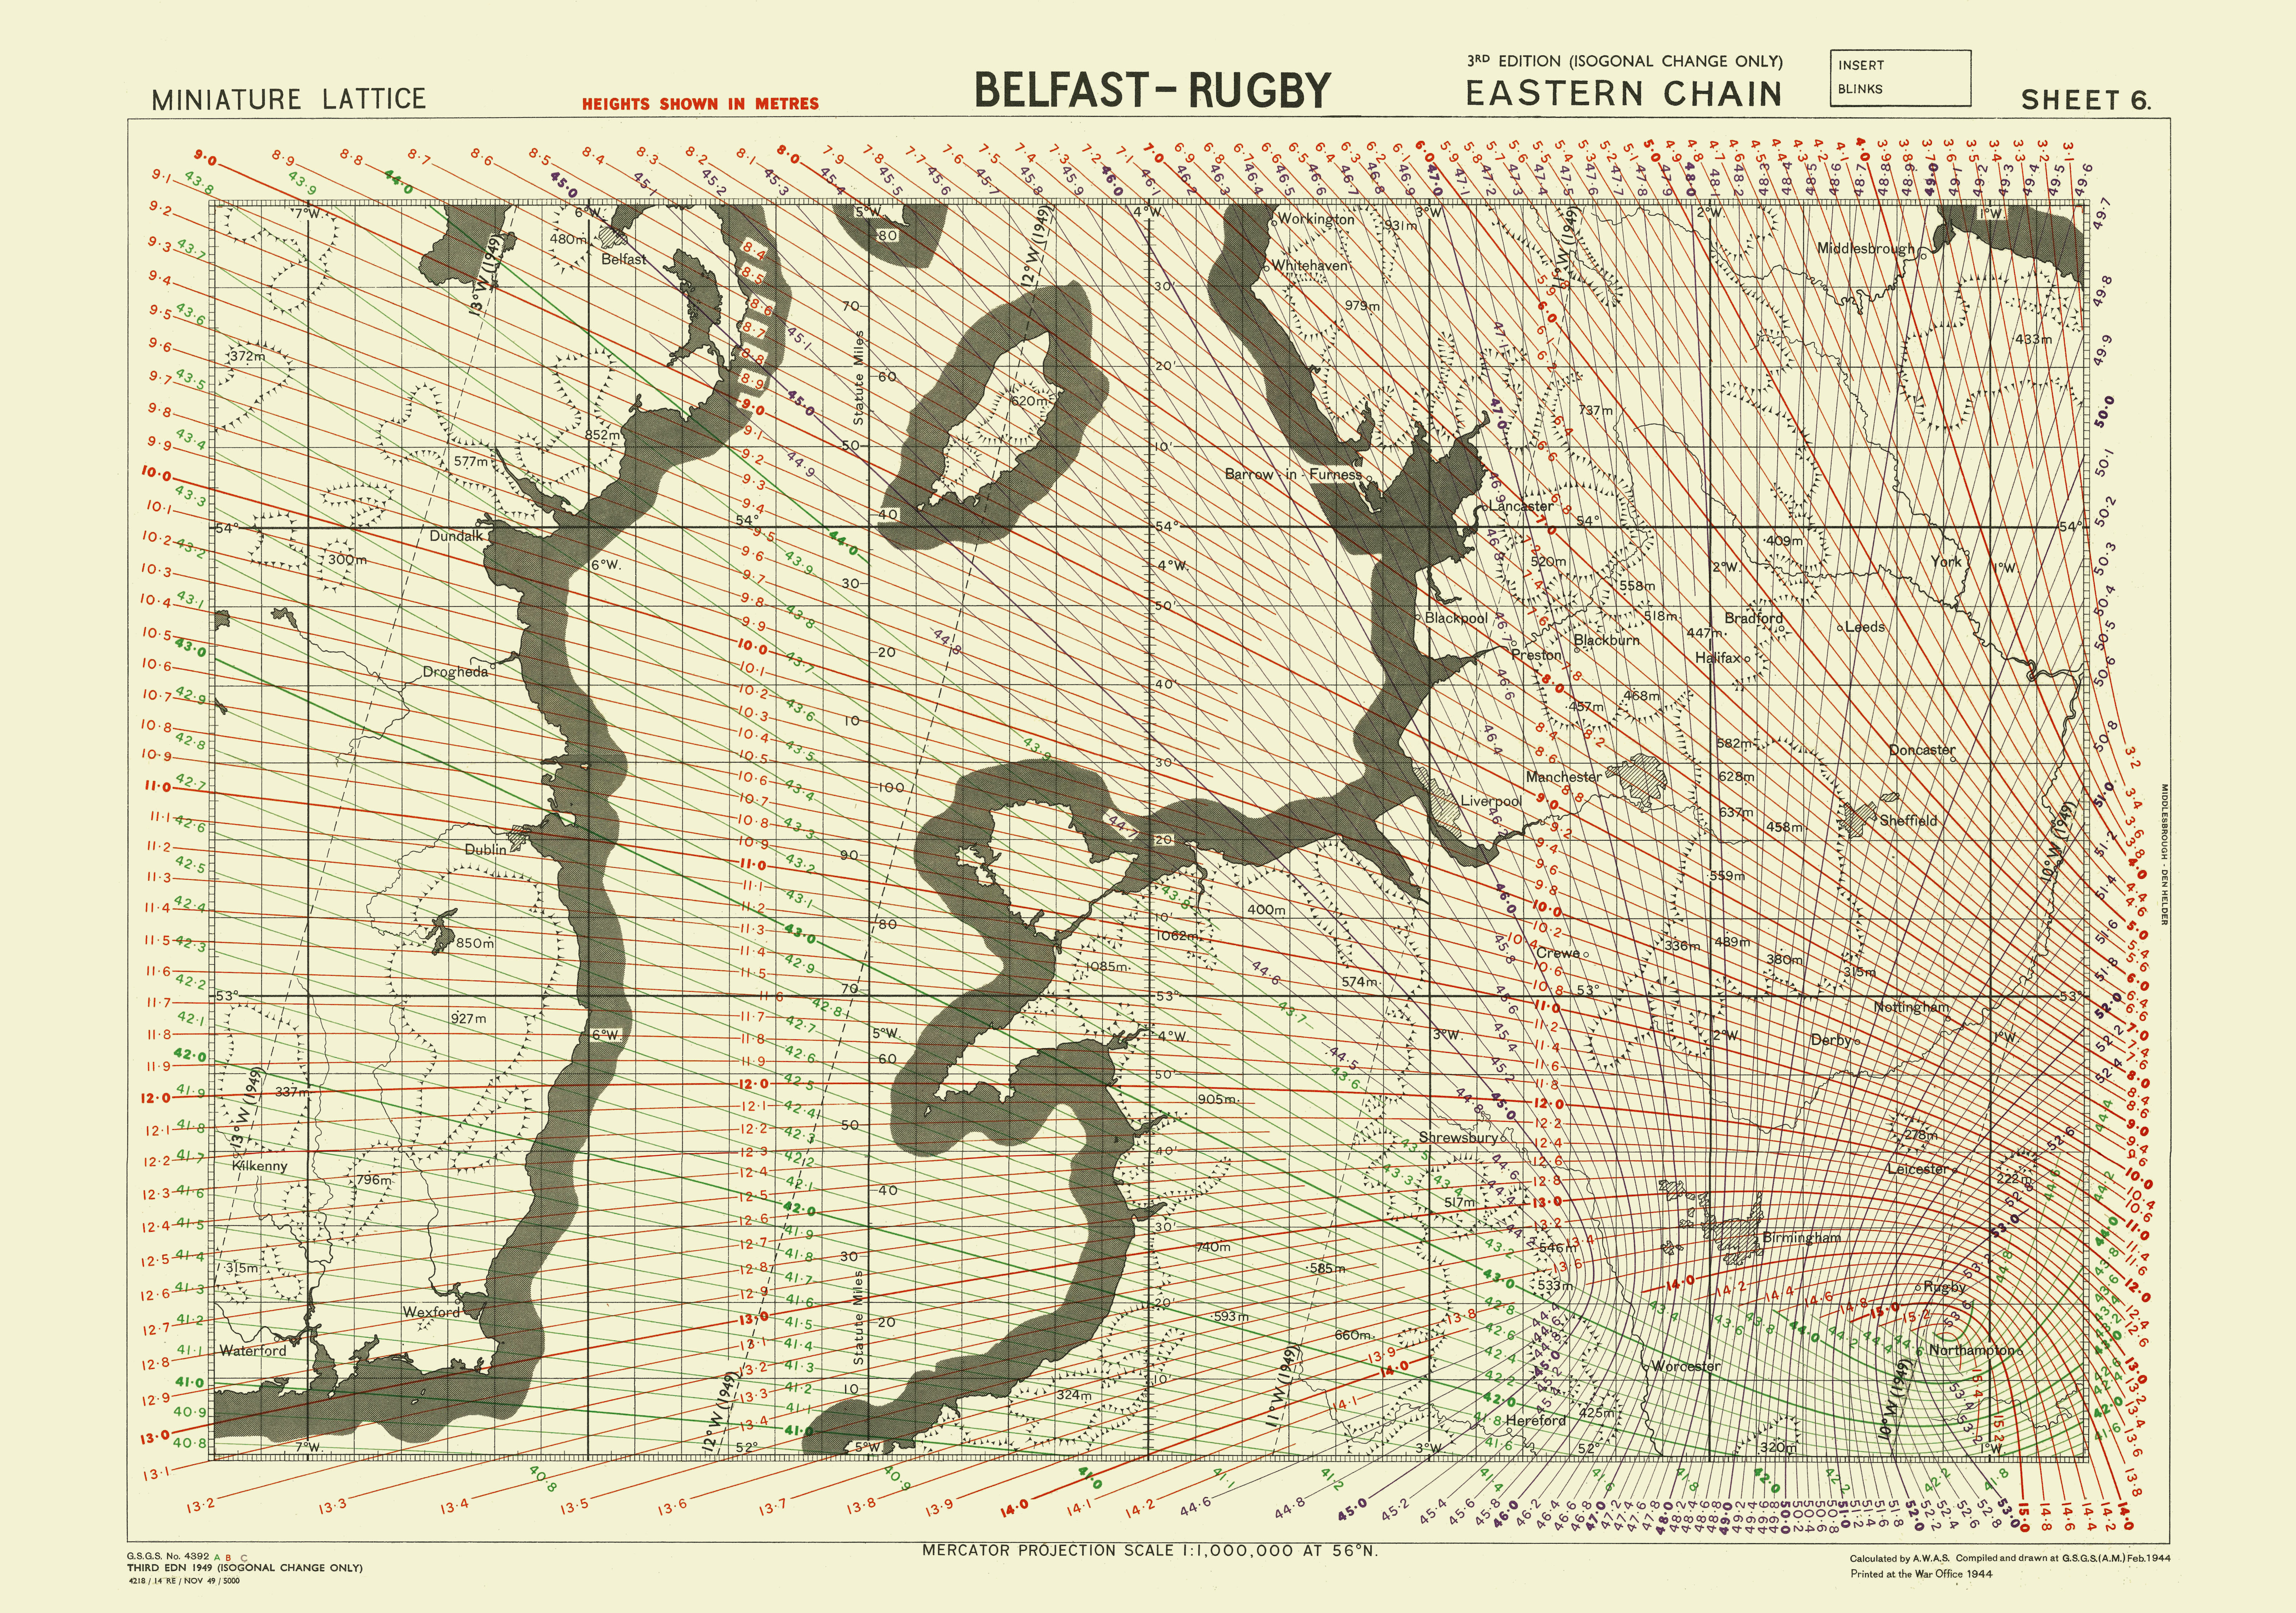
| FIGURE 5.2 |
| Gee lattice chart showing northern England, Wales, and eastern Ireland (postwar reprint of 1944 edition) | |
| British War Office Public Domain: expired Crown Copyright | |
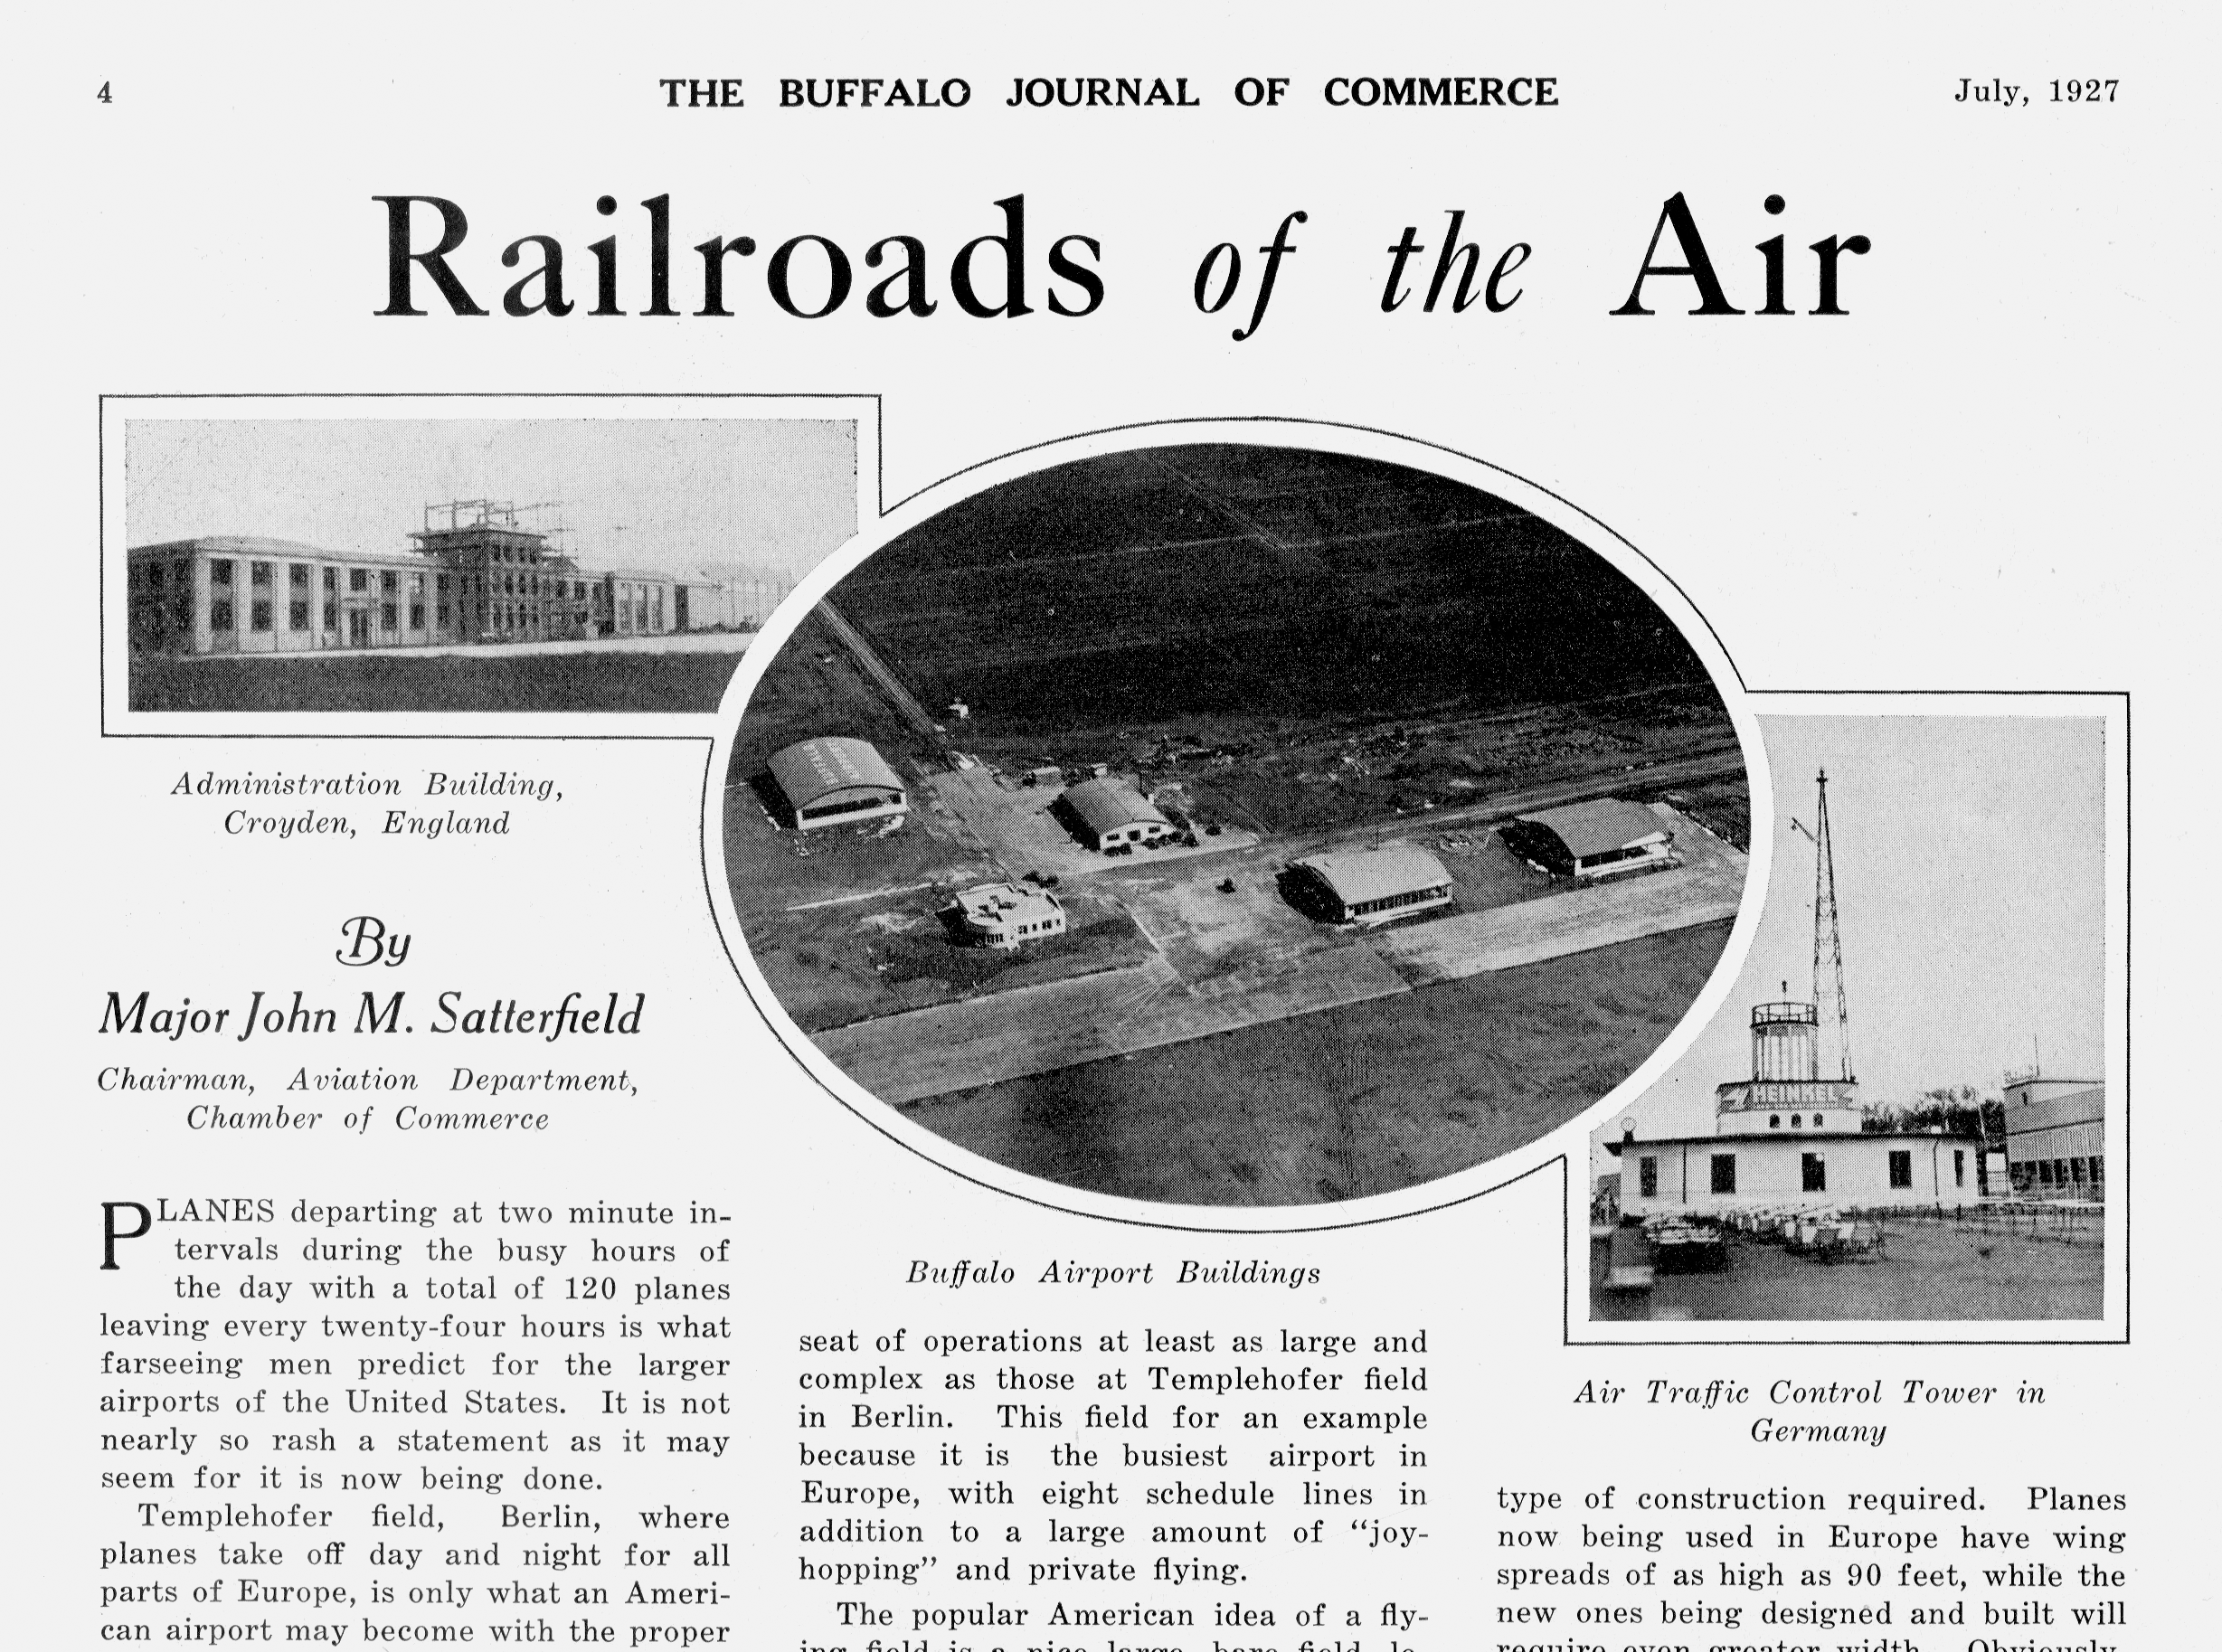
| FIGURE 5.3 |
| A call for public investment in aviation: Buffalo, NY, 1927 | |
| Buffalo Journal of Commerce Public Domain: copyright not renewed | |
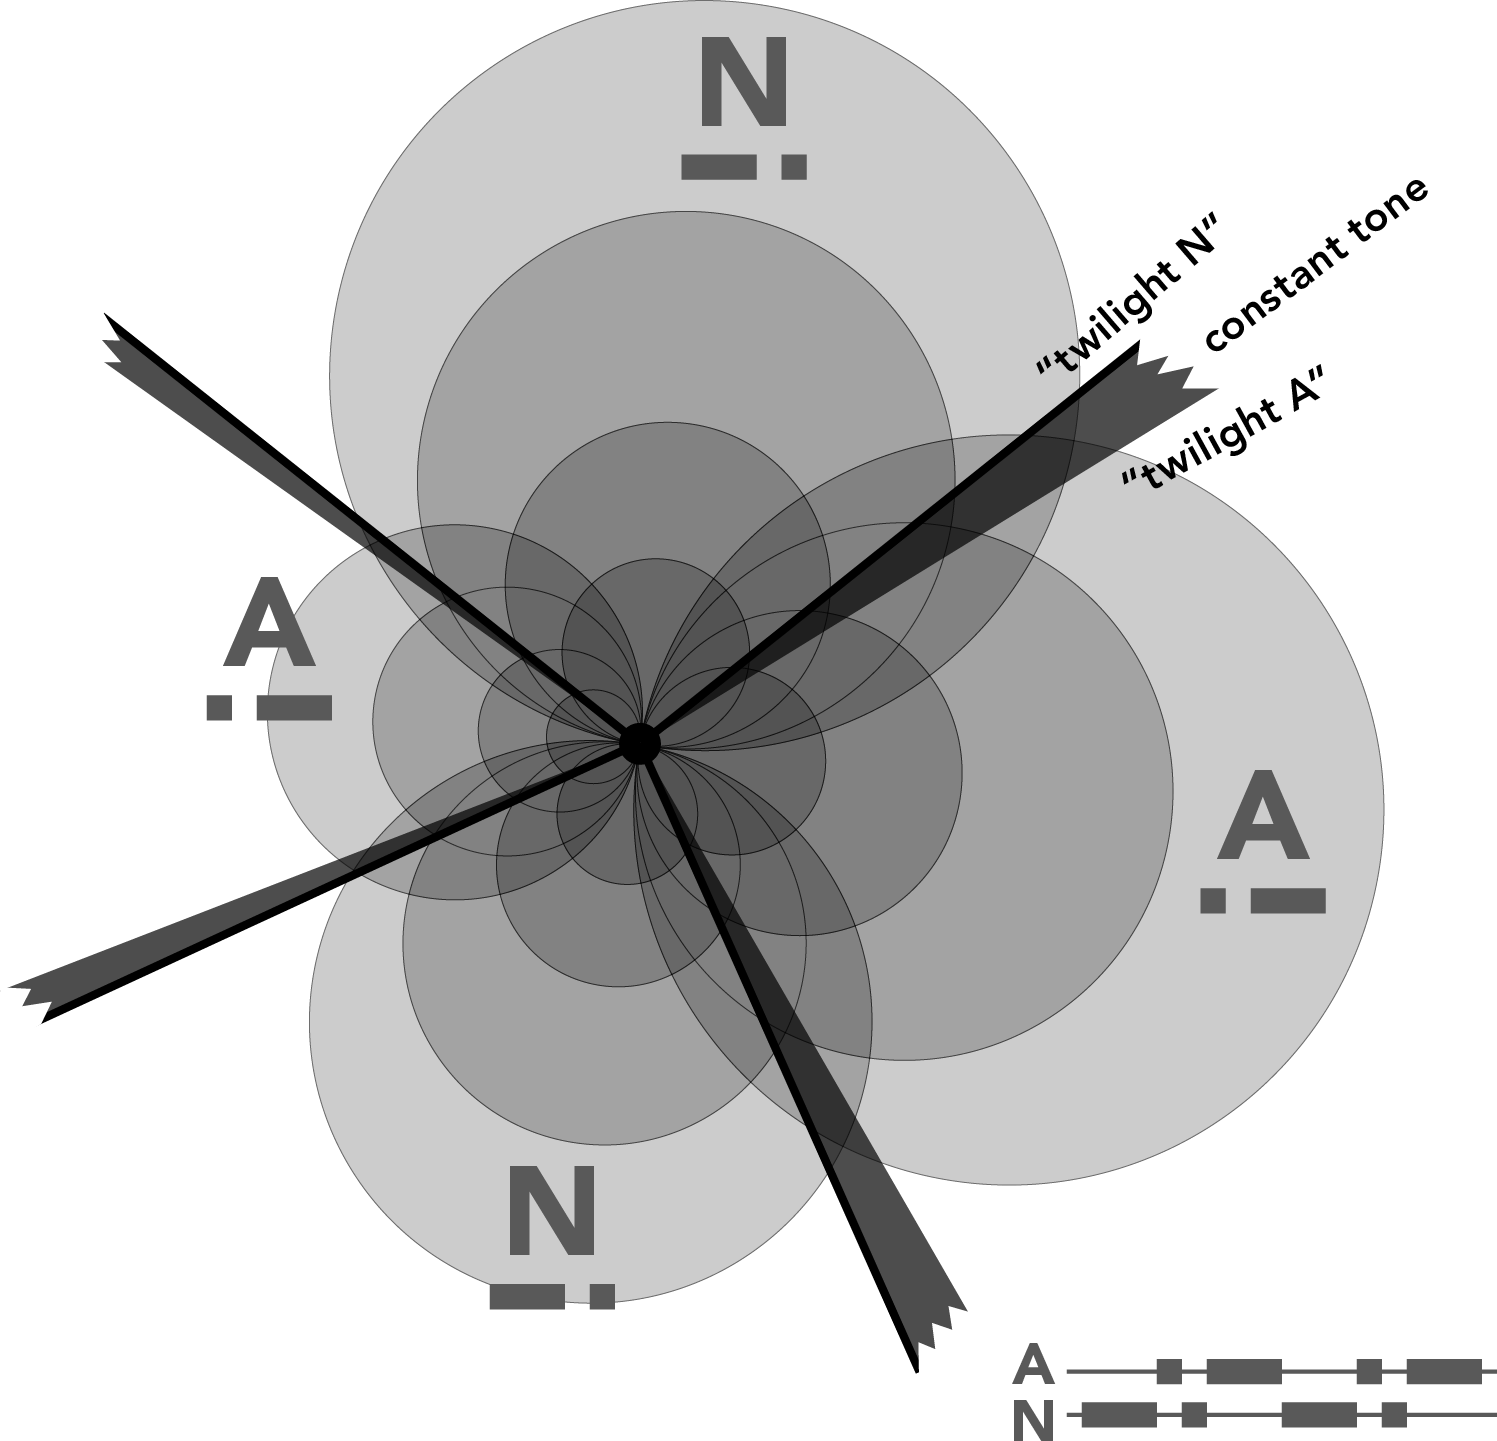
| FIGURE 5.4 |
| The directional Morse-code broadcasts of the US Radio Range create four narrow beams | |
| William Rankin Creative Commons BY-NC-SA | |
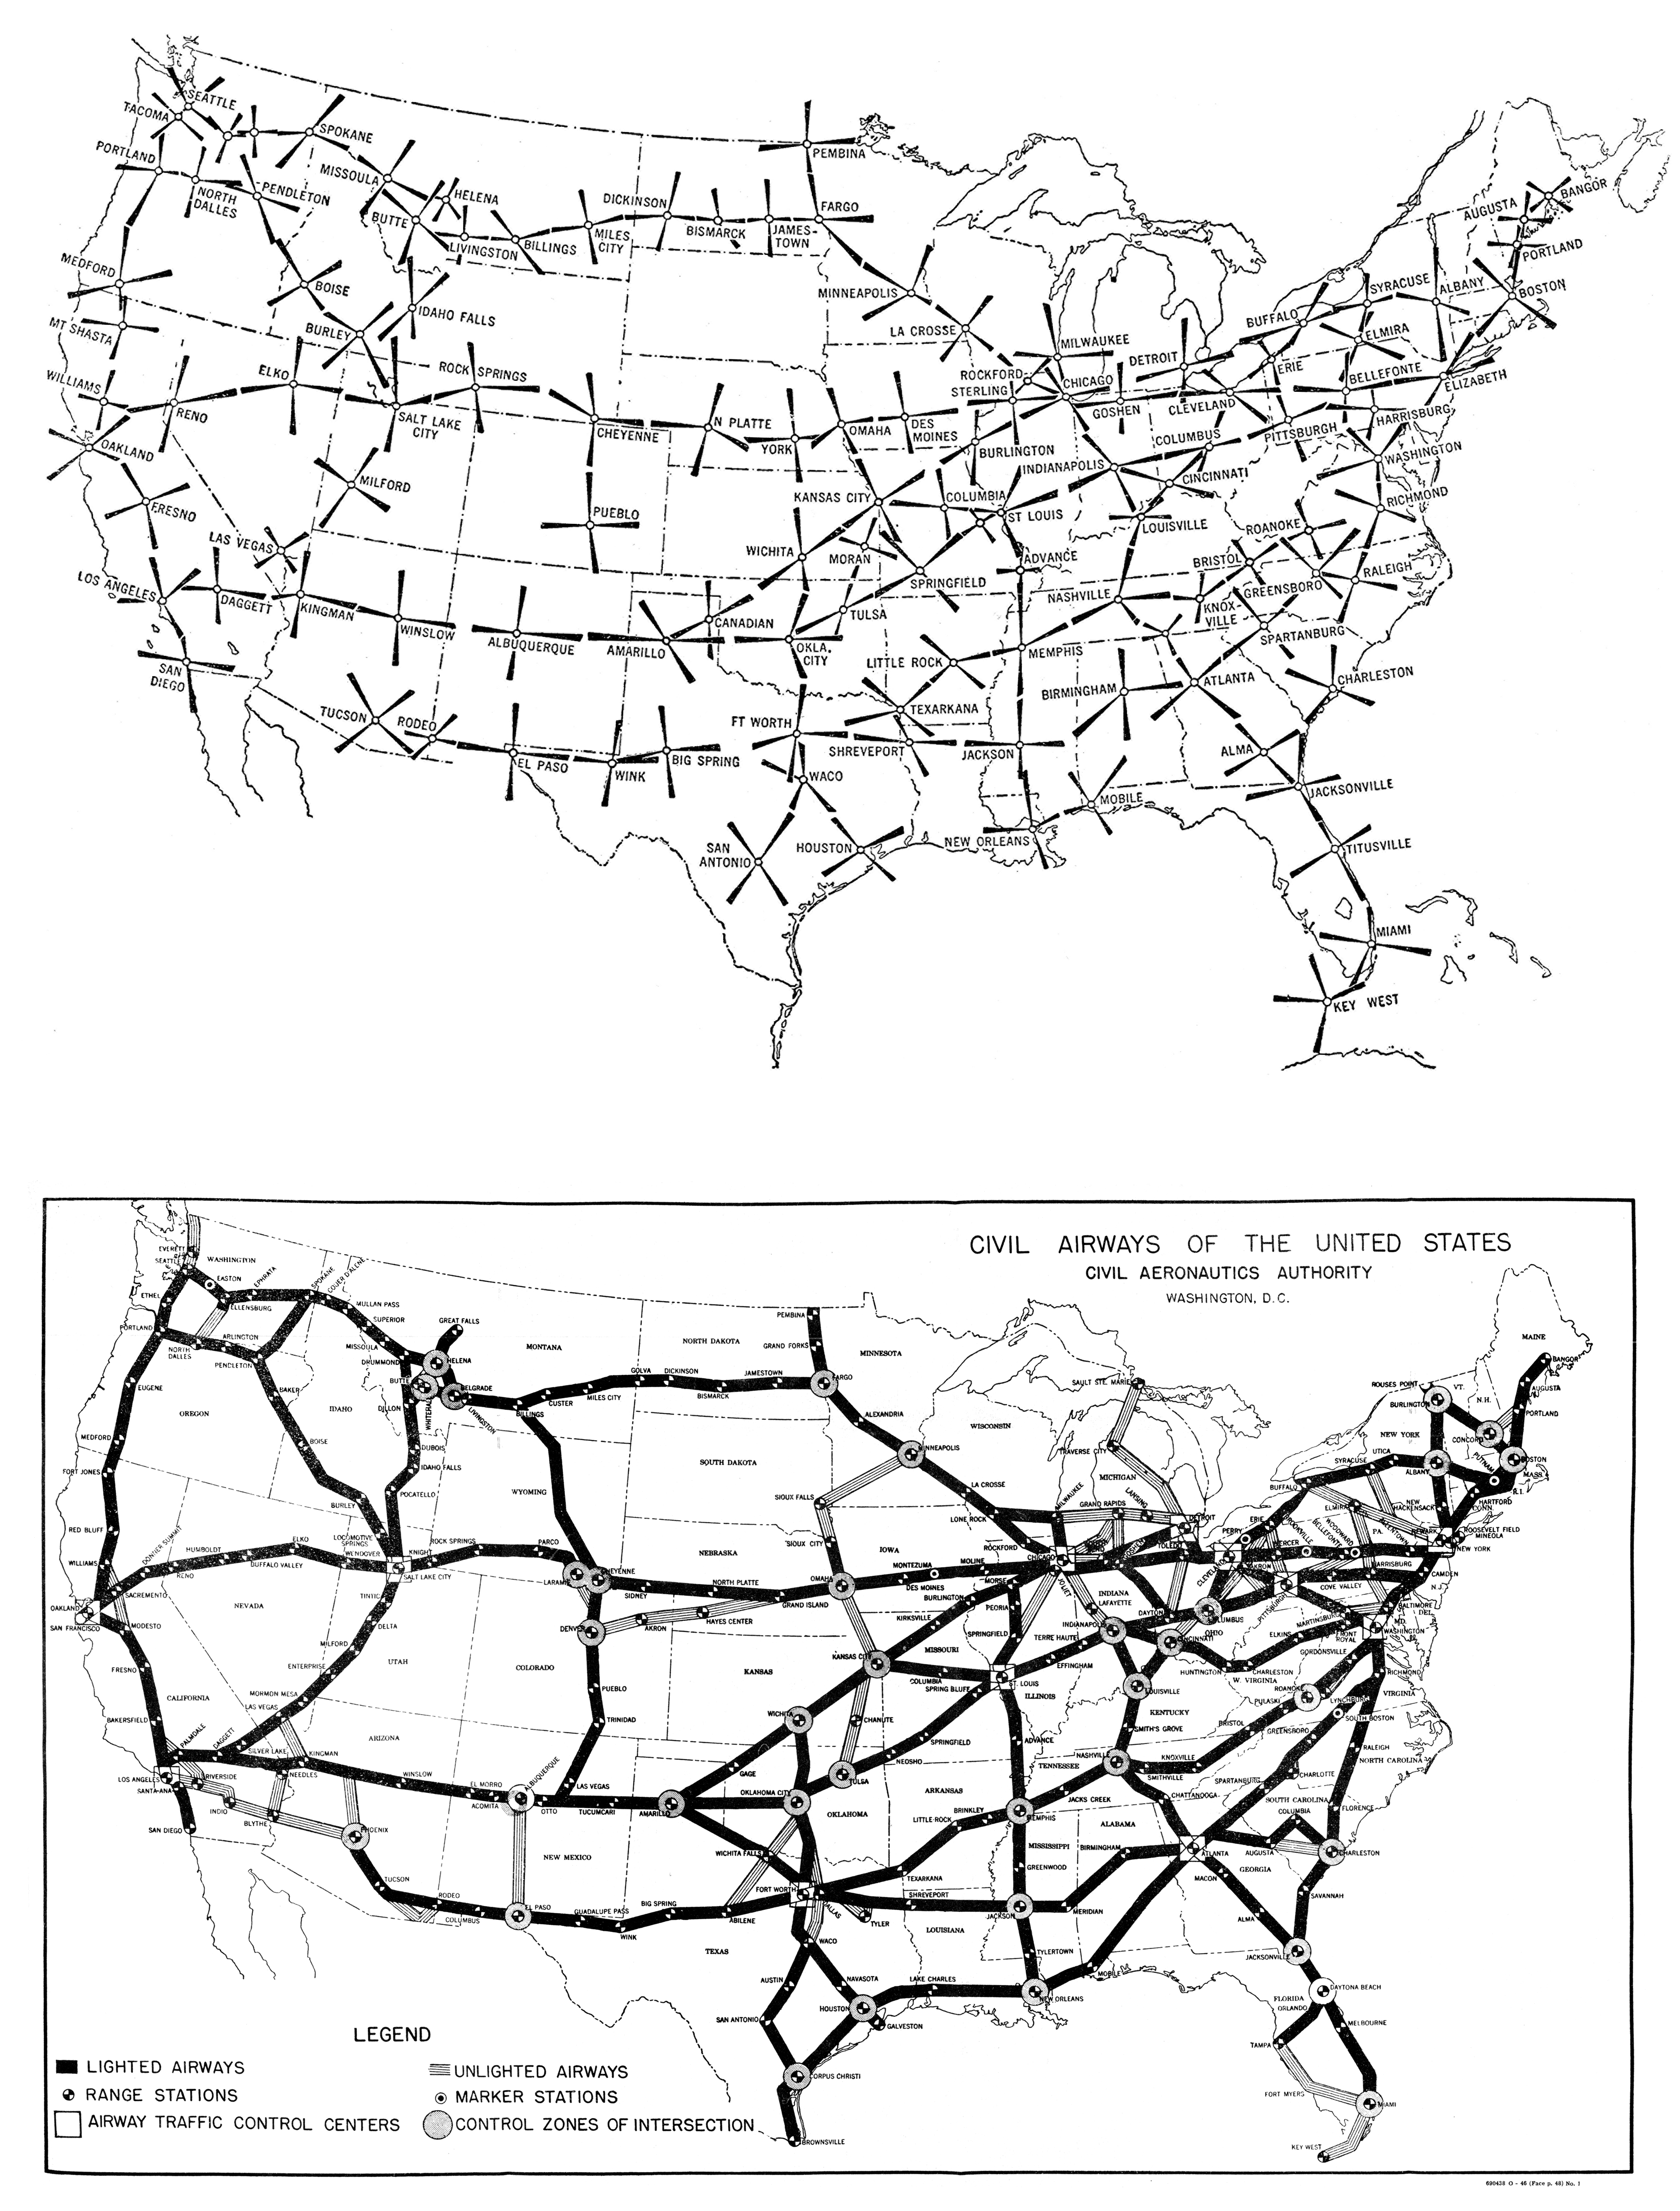
| FIGURE 5.5 |
| The network of Radio-Range airways in the United States in the late 1930s | |
| from Ronald Keen, Wireless Direction
Finding, 3rd ed. (London: Iliffe & Sons, 1938), 484, and Civil Aeronautics Authority, First Annual Report of the Civil Aeronautics Authority (Washington: USGPO, 1940), appendix B Public Domain: US government | |
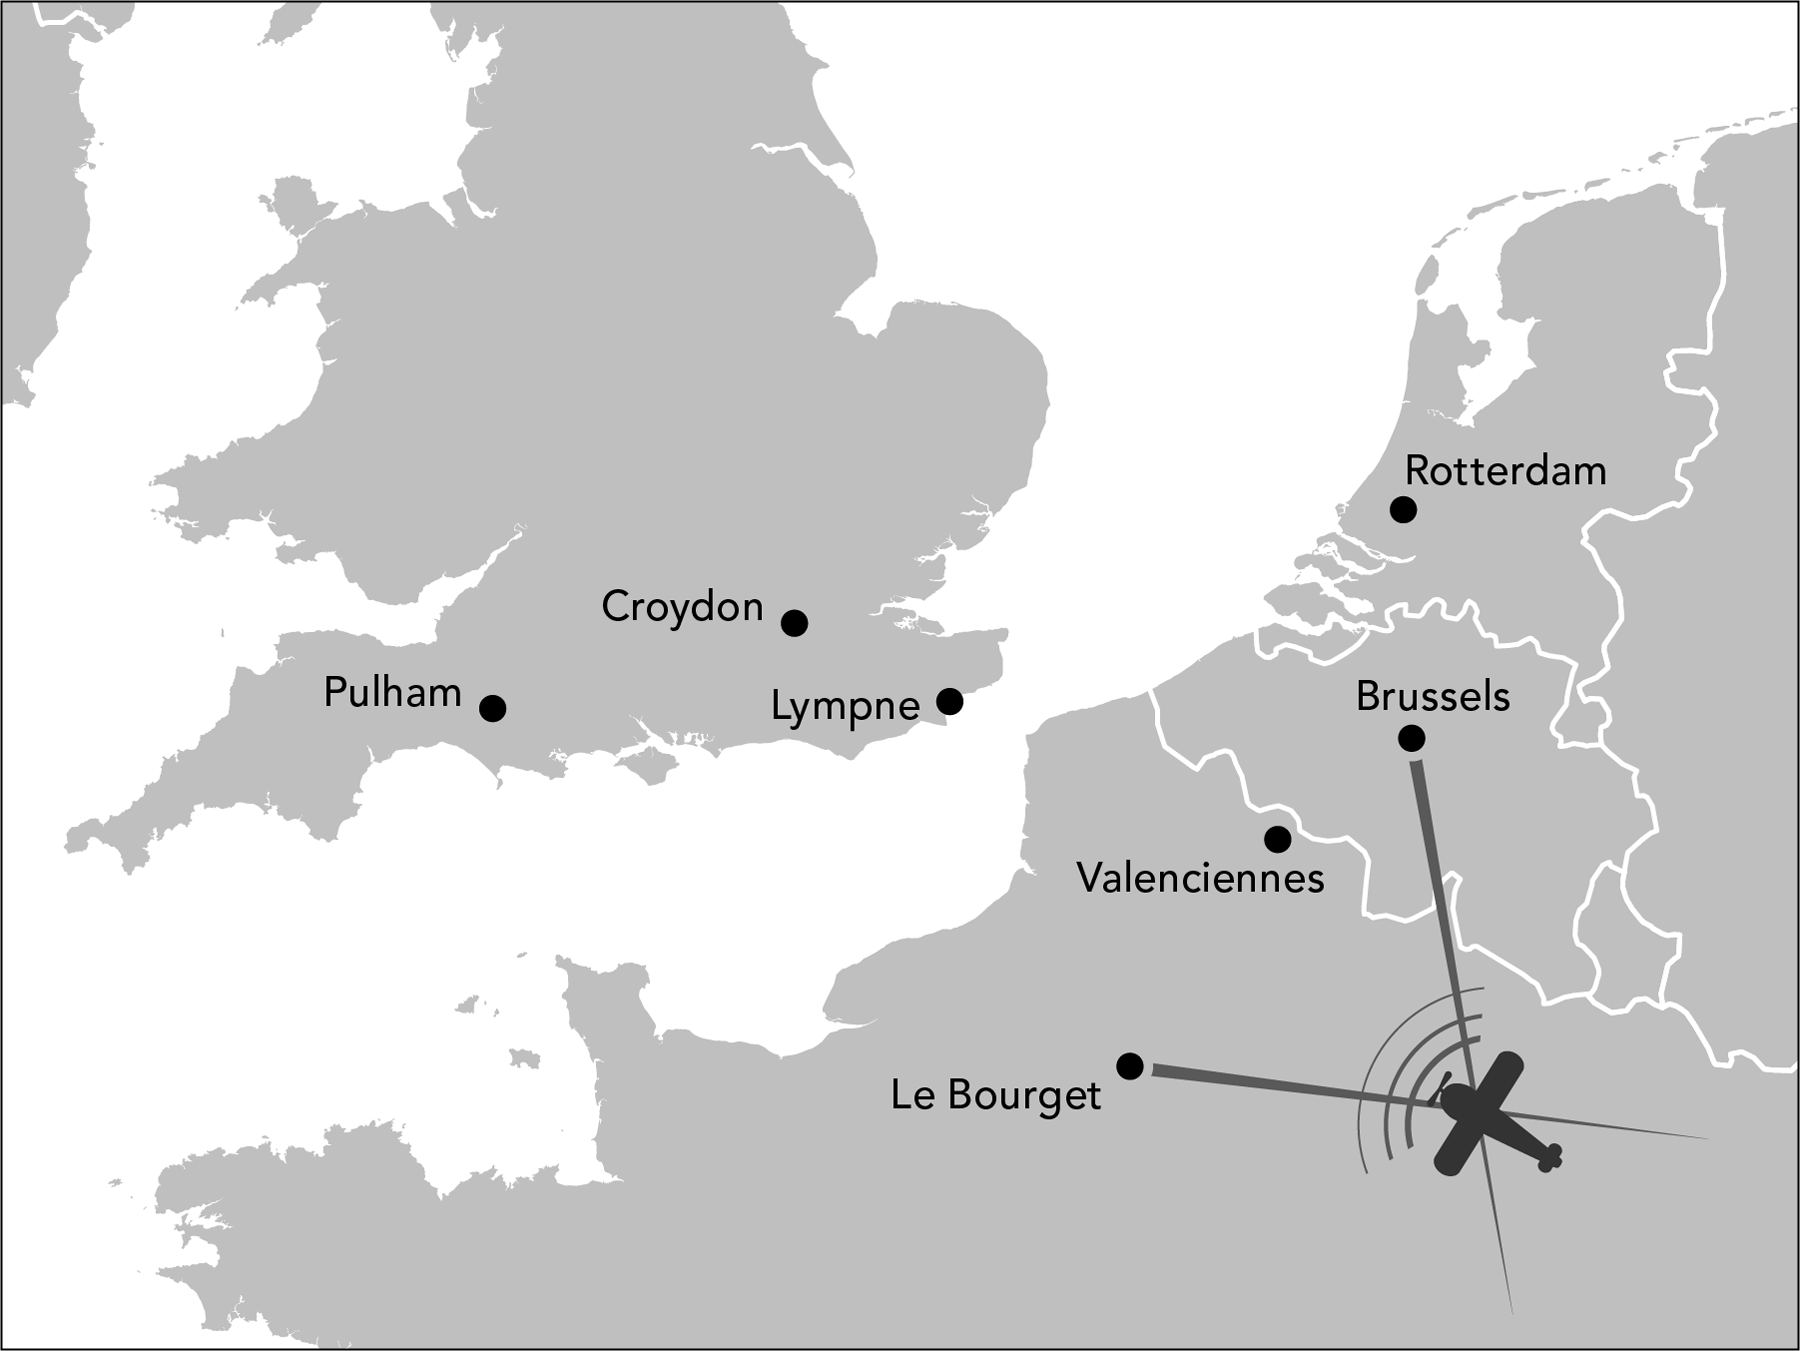
| FIGURE 5.6 |
| Radio Direction Finding (D/F) stations in Europe as of 1931 | |
| William Rankin Creative Commons BY-NC-SA | |
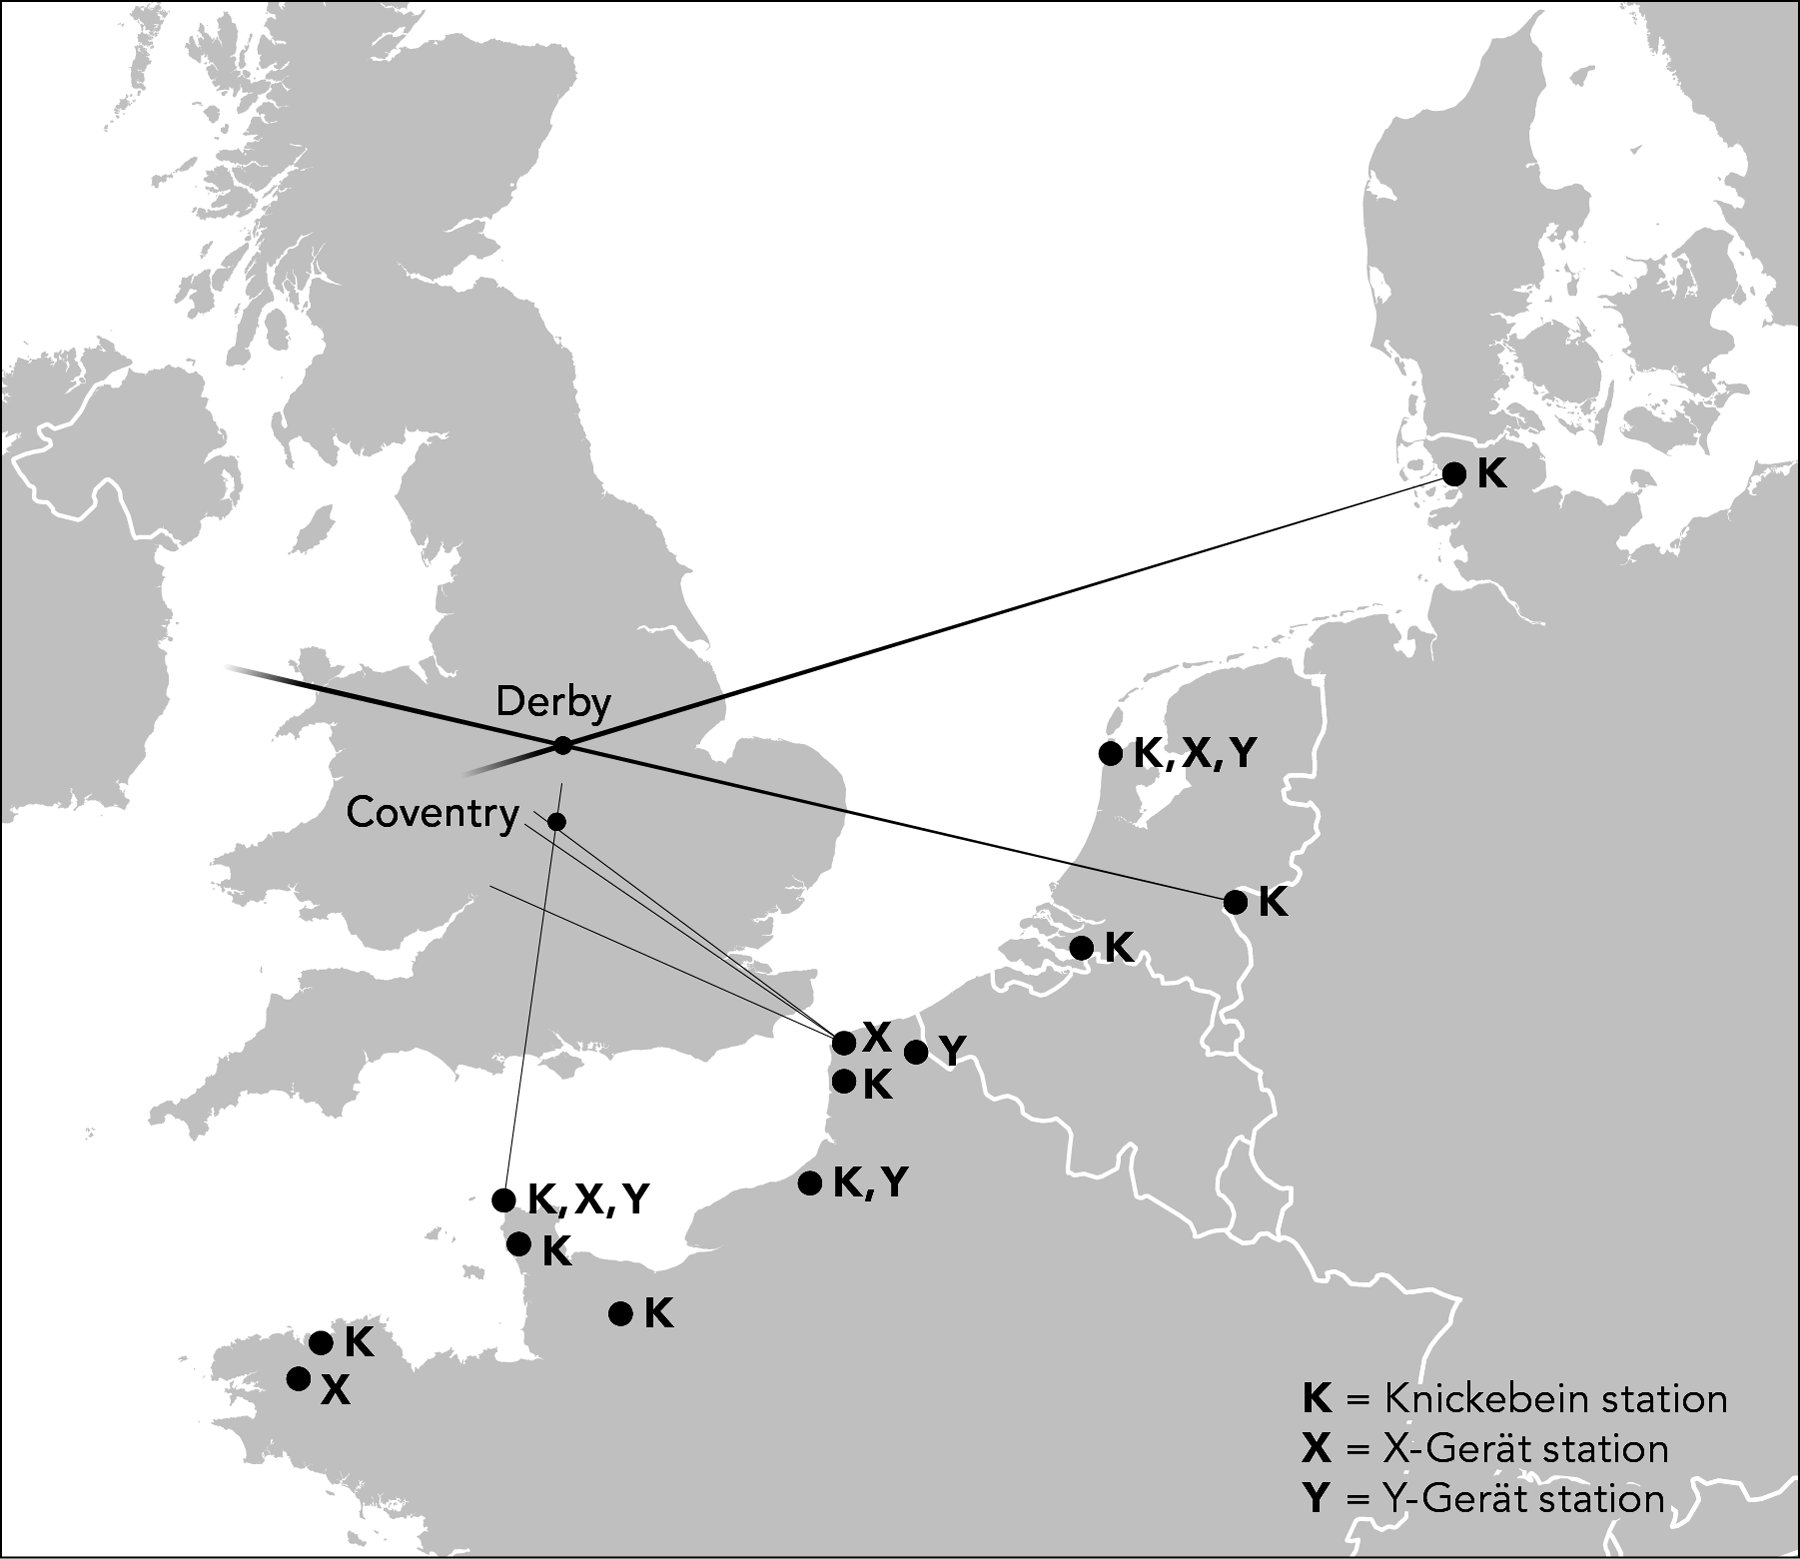
| FIGURE 5.7 |
| German beams aimed at the UK during the Battle of Britain, summer 1941 | |
| William Rankin Creative Commons BY-NC-SA | |
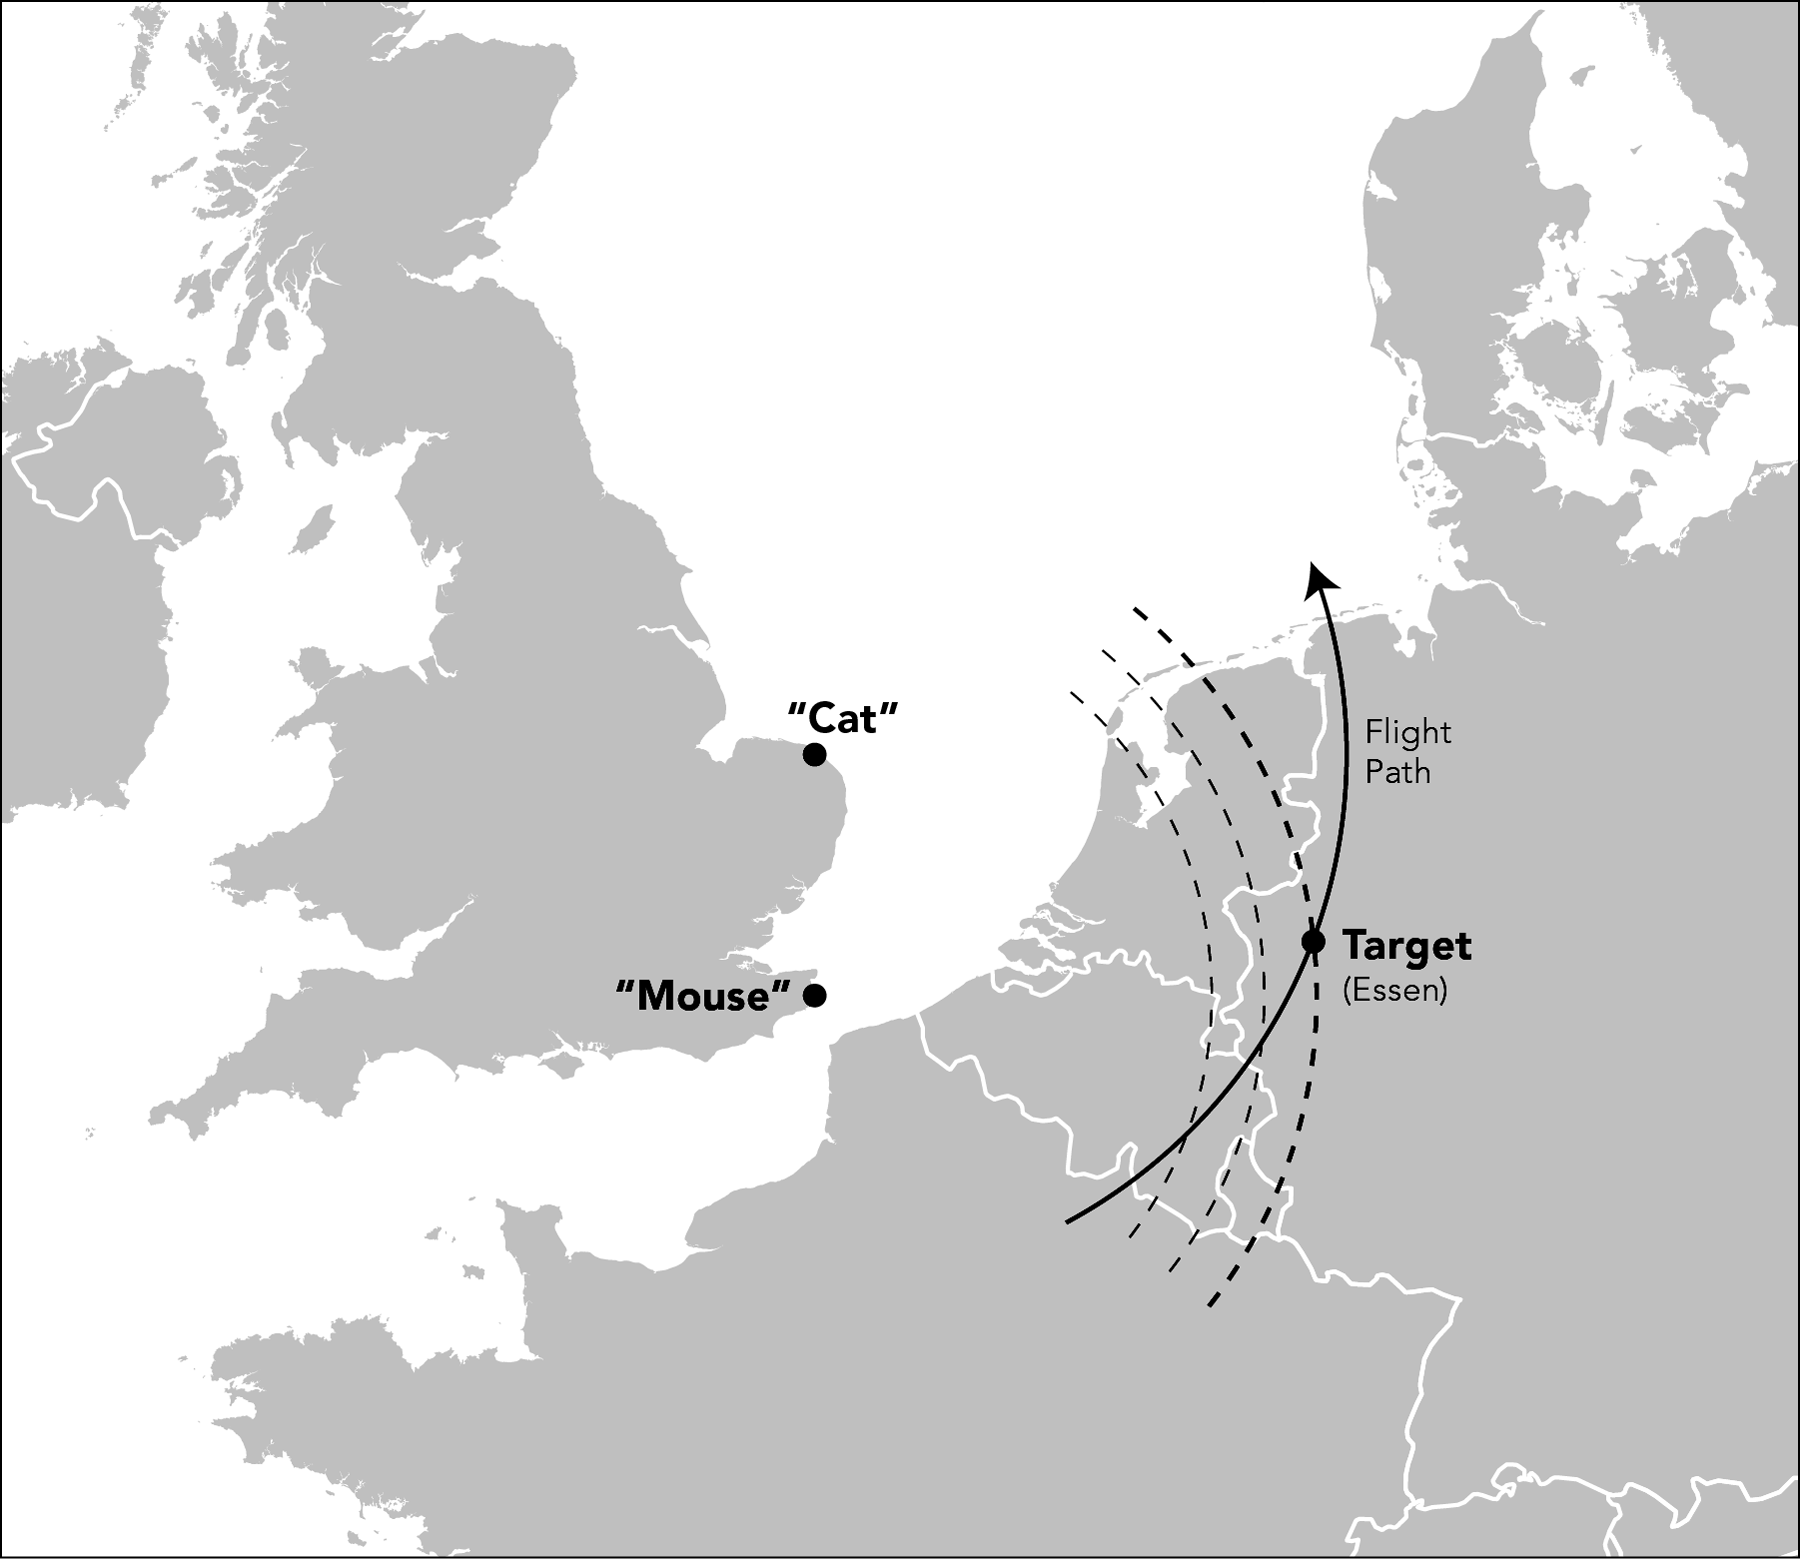
| FIGURE 5.8 |
| The British Oboe system, as configured for a bombing raid on Essen in 1942 | |
| William Rankin Creative Commons BY-NC-SA | |
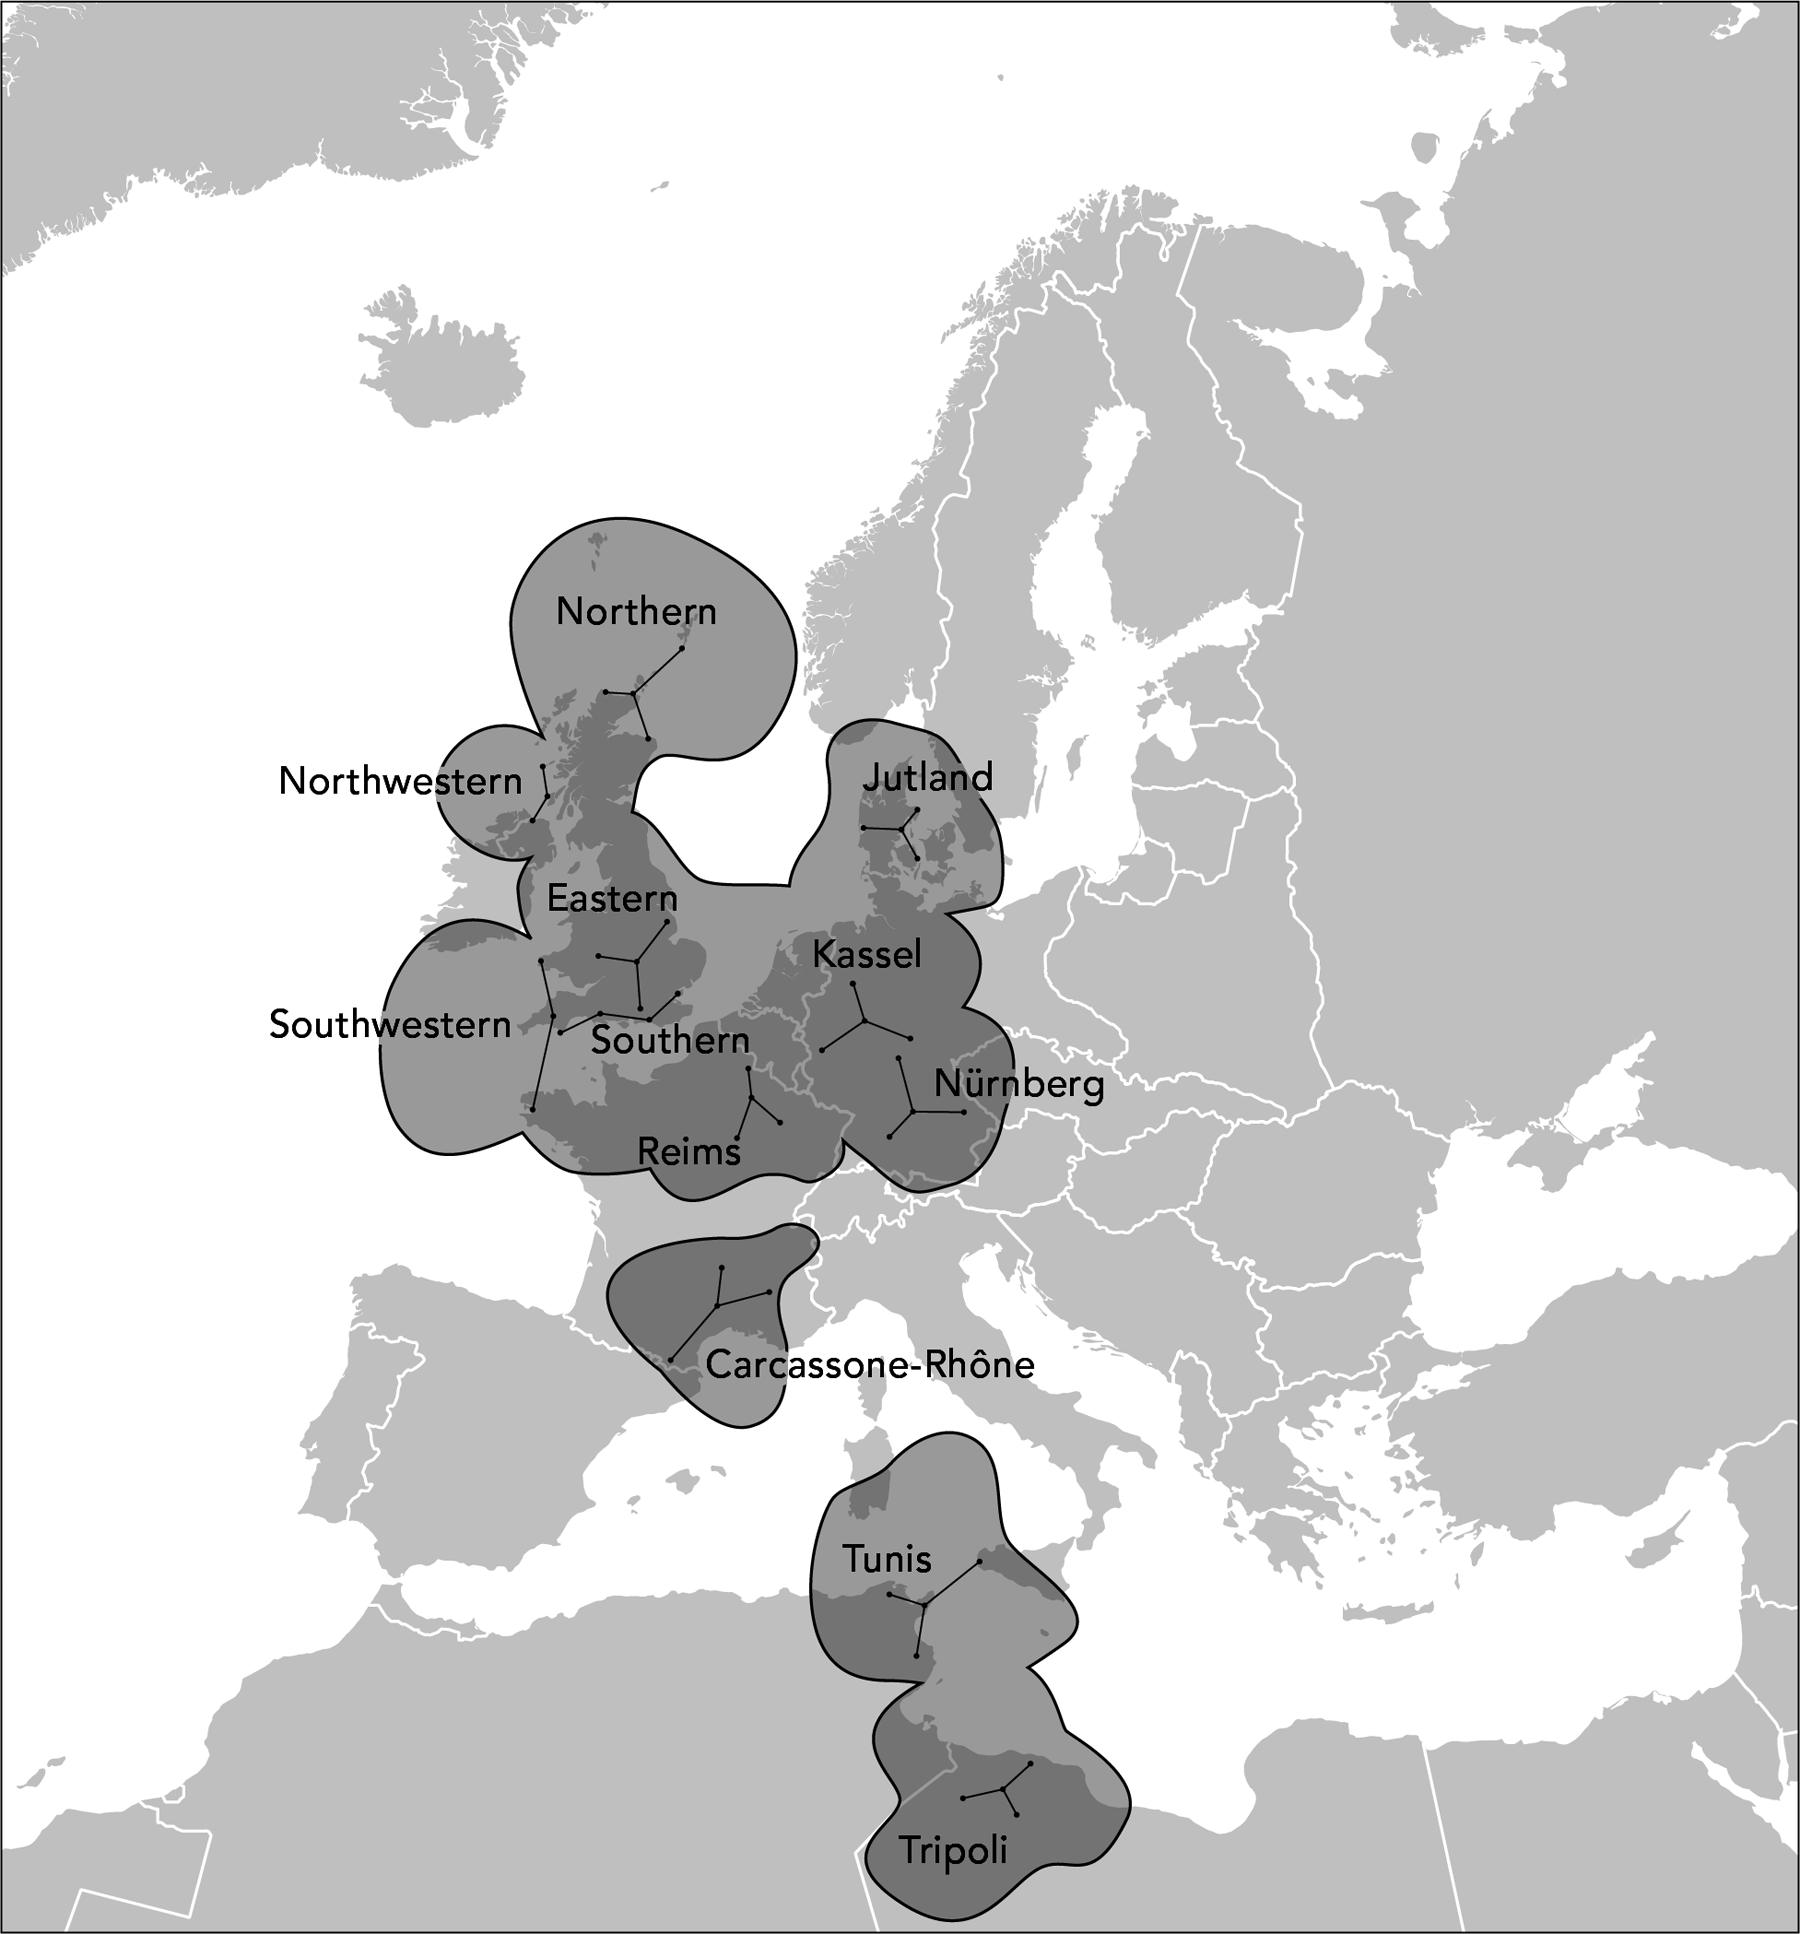
| FIGURE 5.9 |
| European coverage of the British Gee system at the end of World War II | |
| William Rankin Creative Commons BY-NC-SA | |
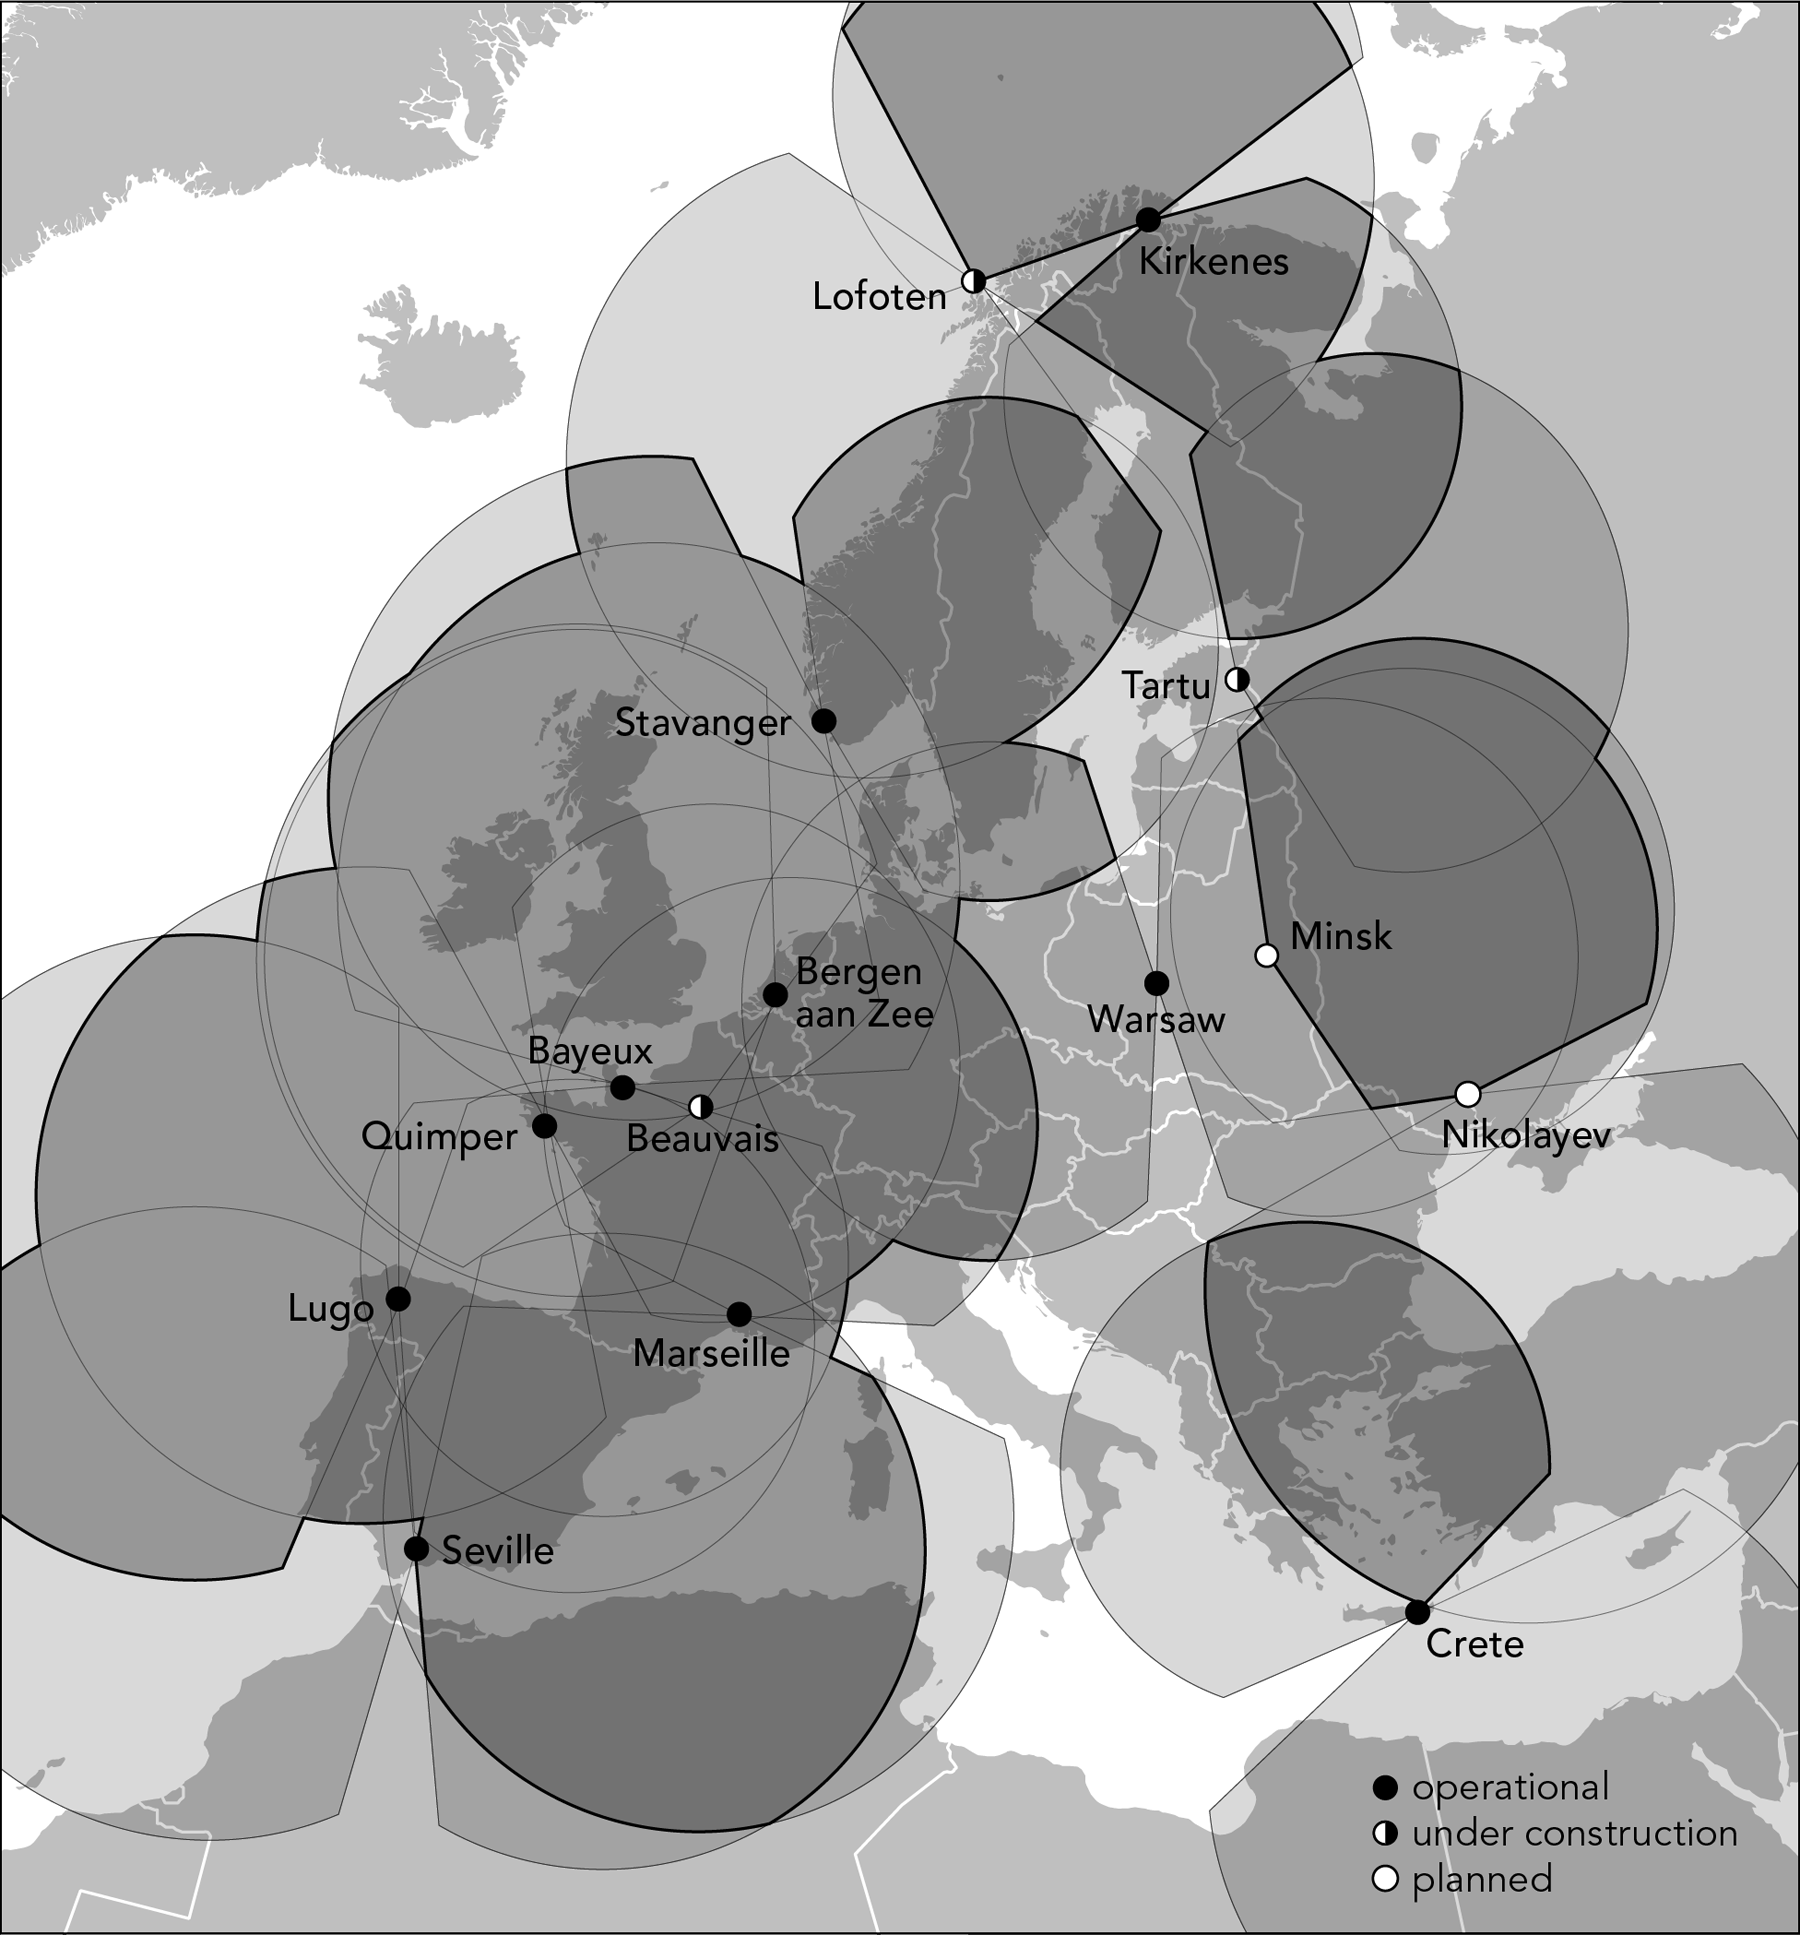
| FIGURE 5.10 |
| Coverage of the German Sonne system at the end of World War II | |
| William Rankin Creative Commons BY-NC-SA | |

| FIGURE 5.11 |
| Coverage of the American Loran system at the end of World War II download transmitter locations and chain connections as GIS layers | |
| William Rankin Creative Commons BY-NC-SA | |

| FIGURE 5.12 |
| Hyperbolic navigation: position is determined by measuring the time difference between signals sent from two synchronized transmitters | |
| William Rankin Creative Commons BY-NC-SA | |

| FIGURE 5.13 |
| The hyperbolic grid of Loran off the east coast of the United States and Canada | |
| from J. A. Pierce, “An Introduction to Loran,” Proceedings of the IRE 34 (May 1946), 219; shading added Public Domain: copyright not renewed | |
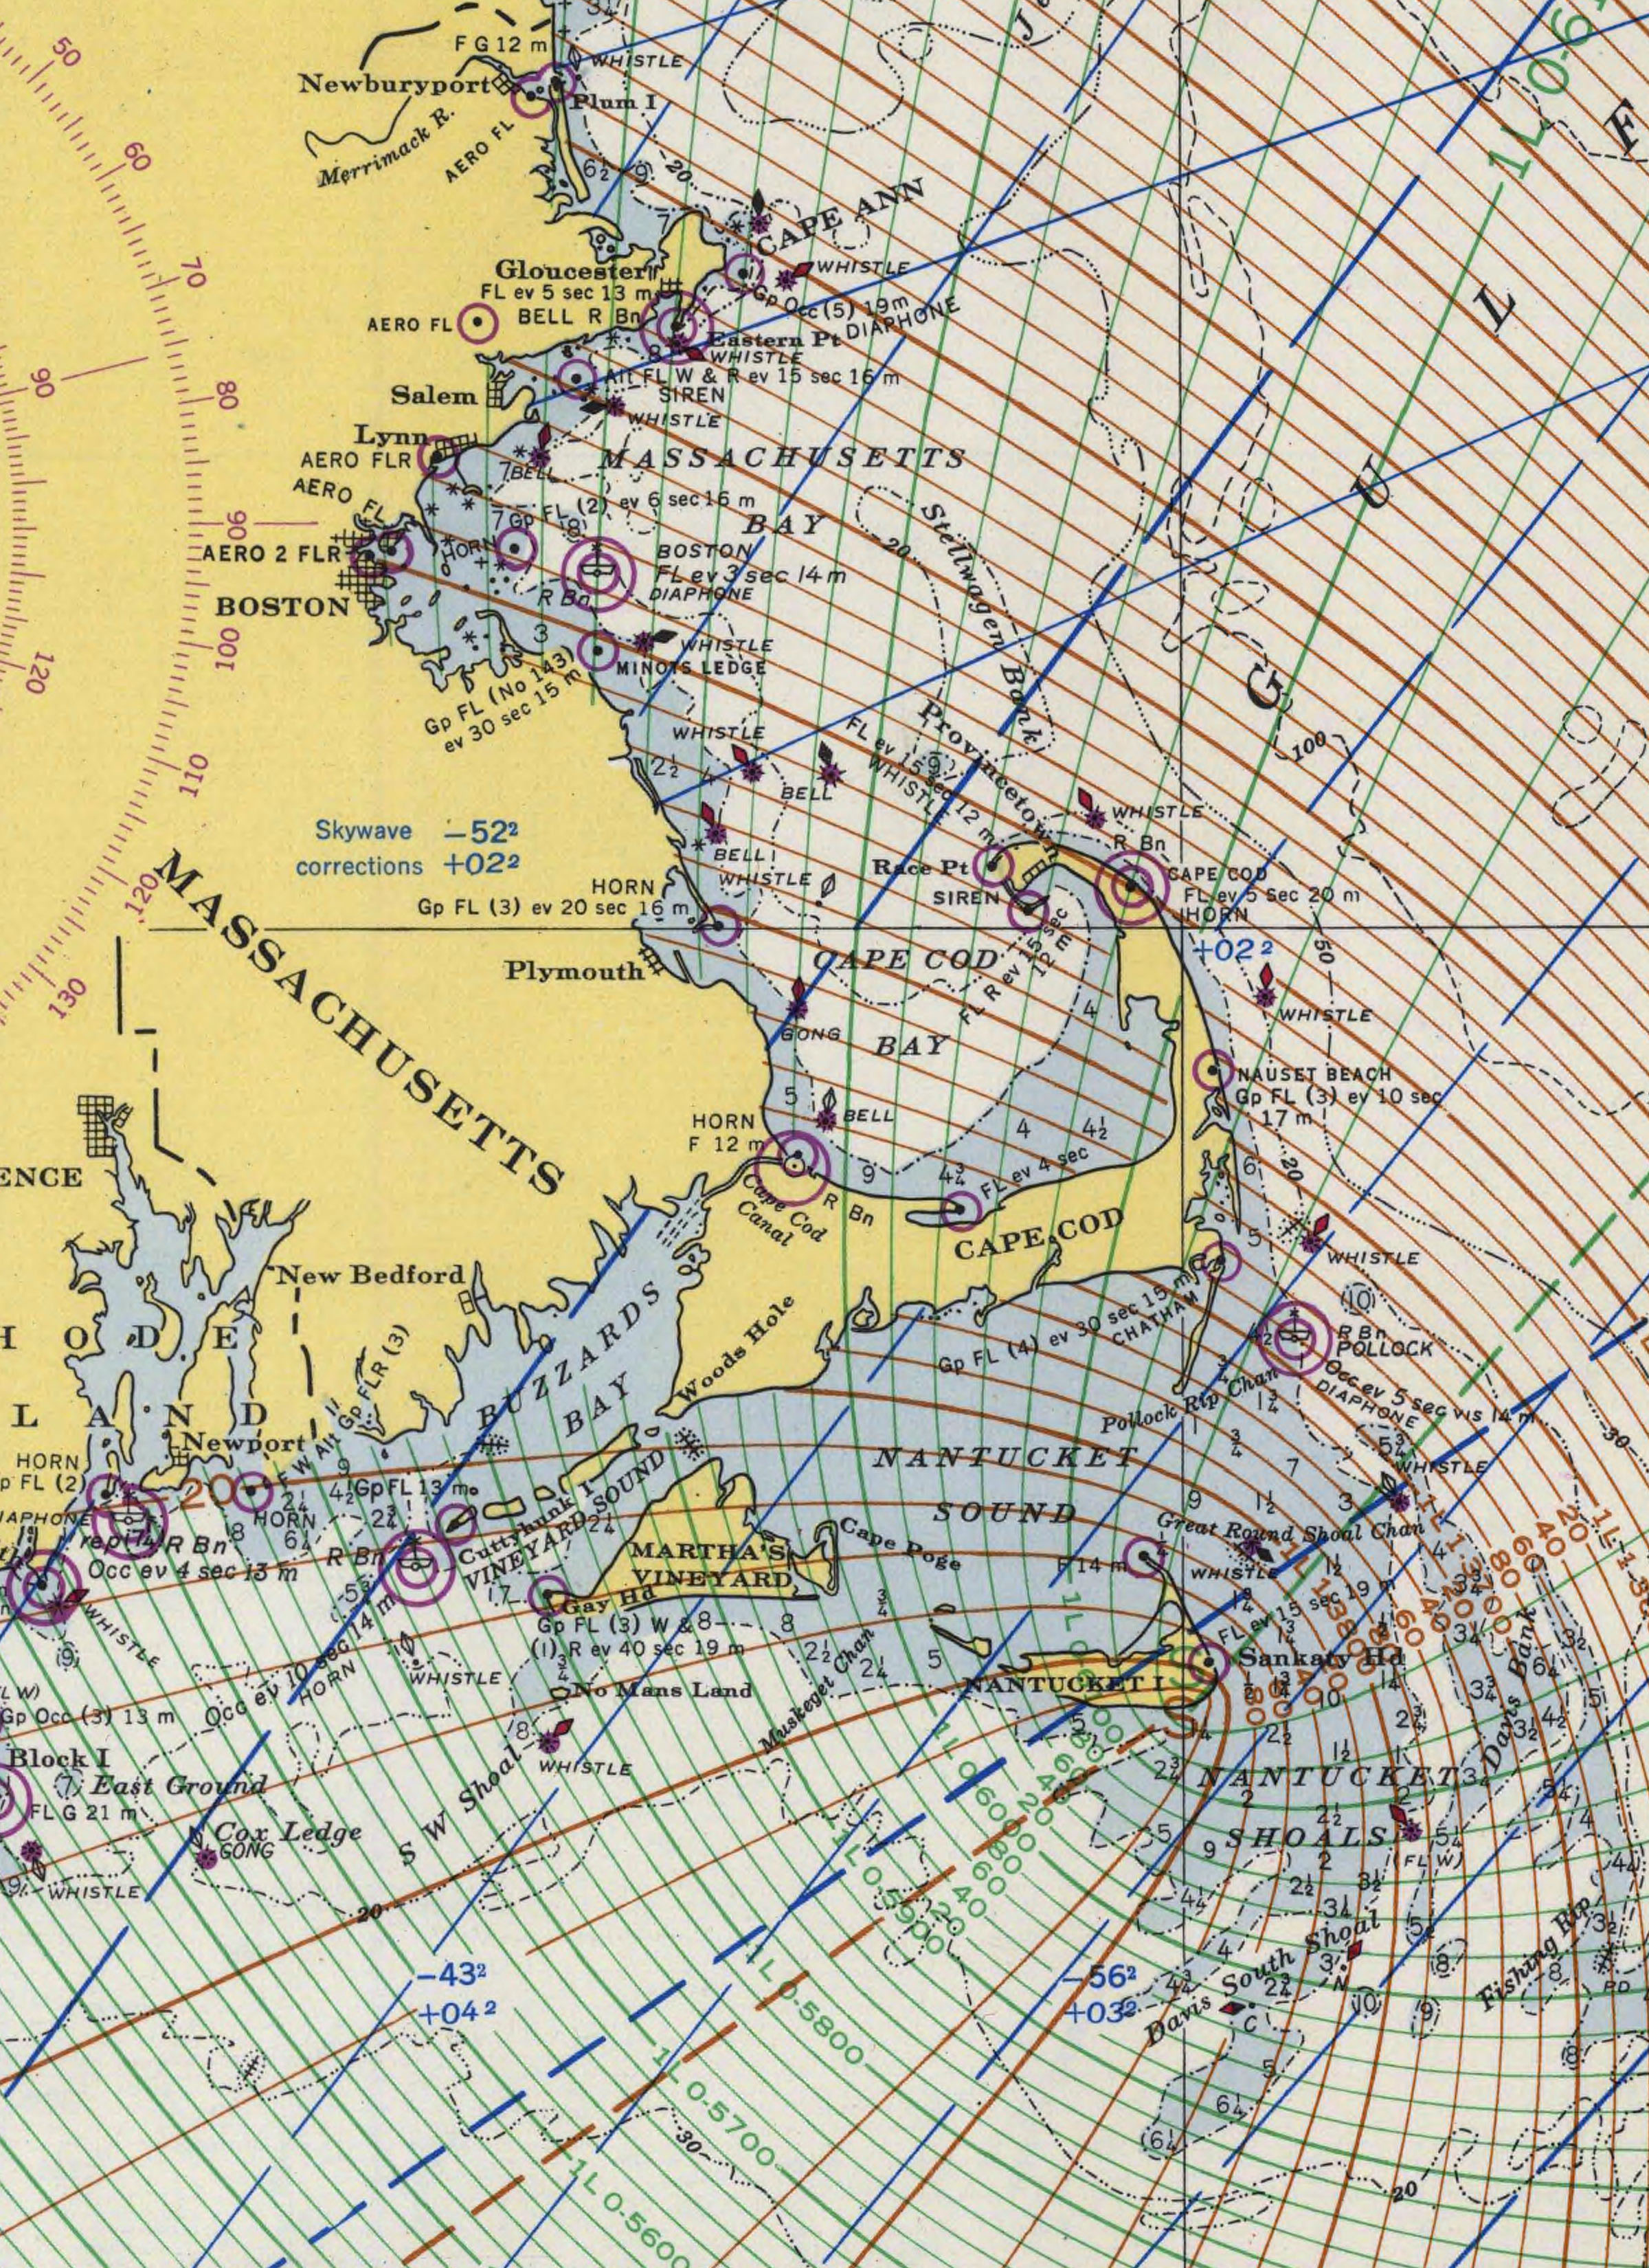
| FIGURE 5.14 |
| Detail of Loran Chart, Atlantic Coast: Cape Sable to Cape Hatteras, chart 1000-L (1948) | |
| US Coast and Geodetic Survey Public Domain: US government | |
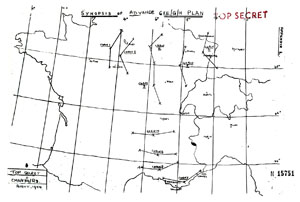
| FIGURE 5.15 |
| Plan for advancing Gee coverage in France and Germany after D-Day | |
| British War Office Copyright 1944 | |
| FIGURE 5.16 |
| Trilateration surveying with Shoran after World War II | |
| from Carl Aslakson, “The Influence of Electronics on Surveying and Mapping,” Surveying and Mapping (July–Sept 1950), 167 Public Domain: copyright not renewed | |
| FIGURE 5.17 |
| Trilateration performed during the 1950s and 1960s (shaded in gray) | |
| from Defense Mapping Agency, Geodesy for the Layman, 5th ed. (Washington: DMA, 1983; map dated 1971), 18; shading added Public Domain: US government | |
| FIGURE 5.18 |
| Advertisement for offshore radio surveying, 1959 | |
| from Surveying and Mapping (Mar 1959), 141 Public Domain: copyright not renewed | |
| FIGURE 5.19 |
| Advertisement for offshore radio surveying, 1971 | |
| Surveying and Mapping Copyright 1971 | |
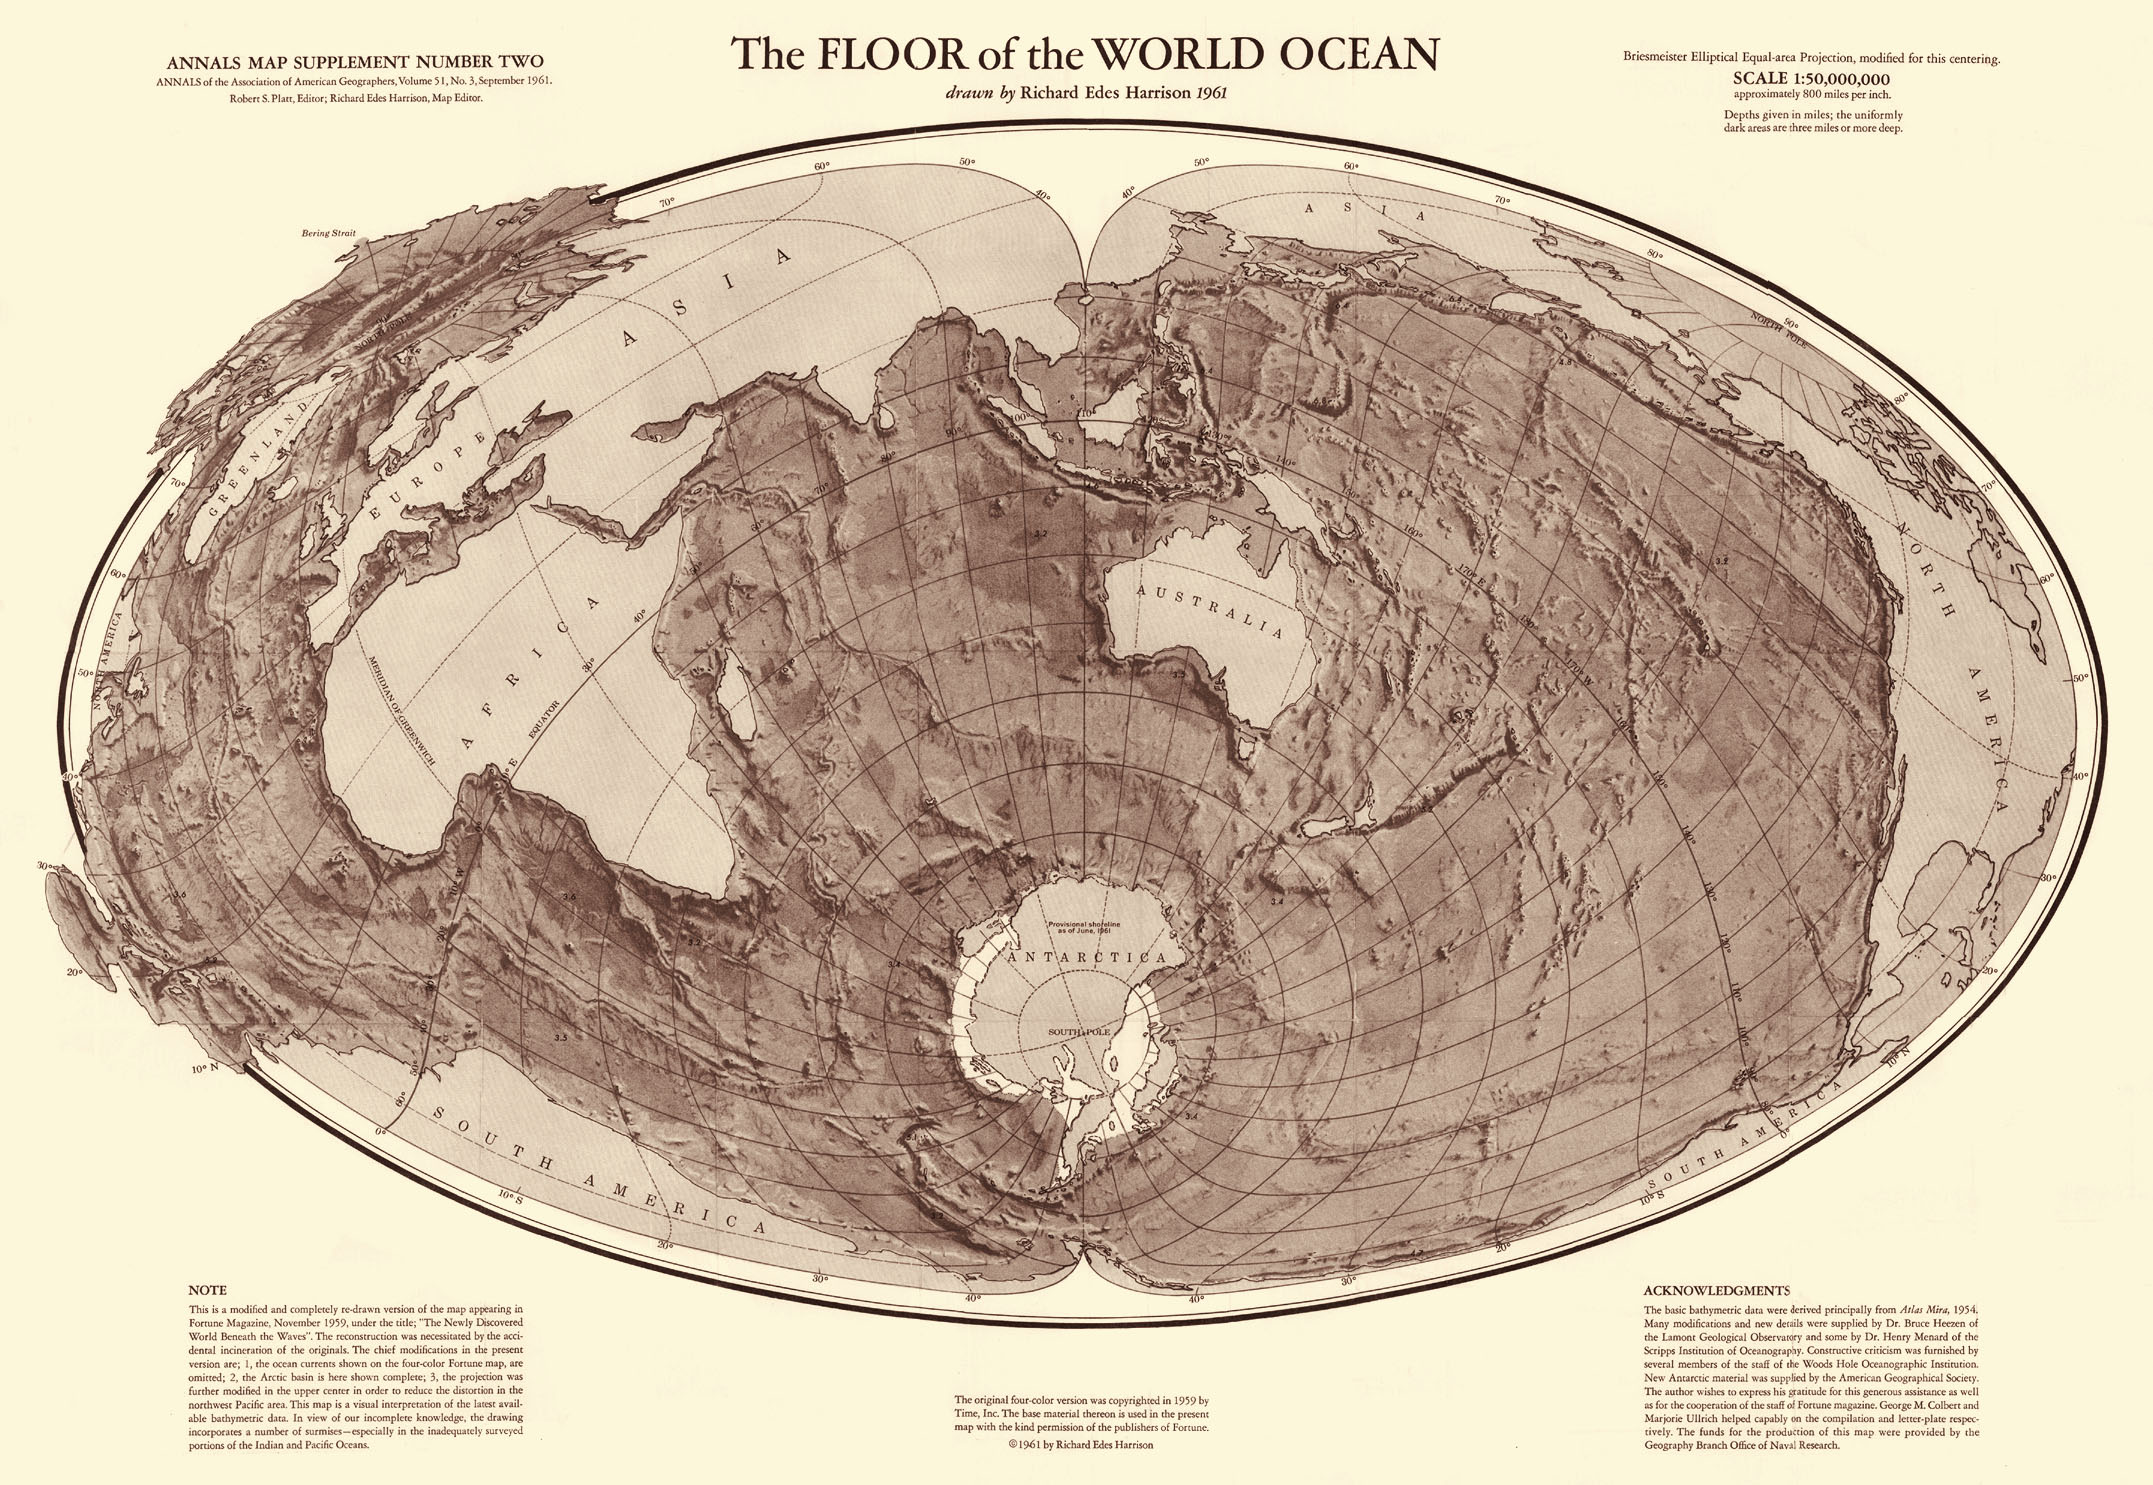
| FIGURE 5.20 |
| The Floor of the World Ocean, by Richard Edes Harrison (1961 version of 1959 original) | |
| from Annals of the Association of
American Geographers 51 (Sept 1961) Public Domain: copyright not renewed | |

| FIGURE 5.21 |
| British proposal for worldwide Consol and Decca coverage, 1947 | |
| from International Meeting on Marine Radio Aids to Navigation: Proceedings and Related Documents, April 28 –
May 9, 1947 (Washington: State Department, 1948), facing 438; shading added Public Domain: US government | |
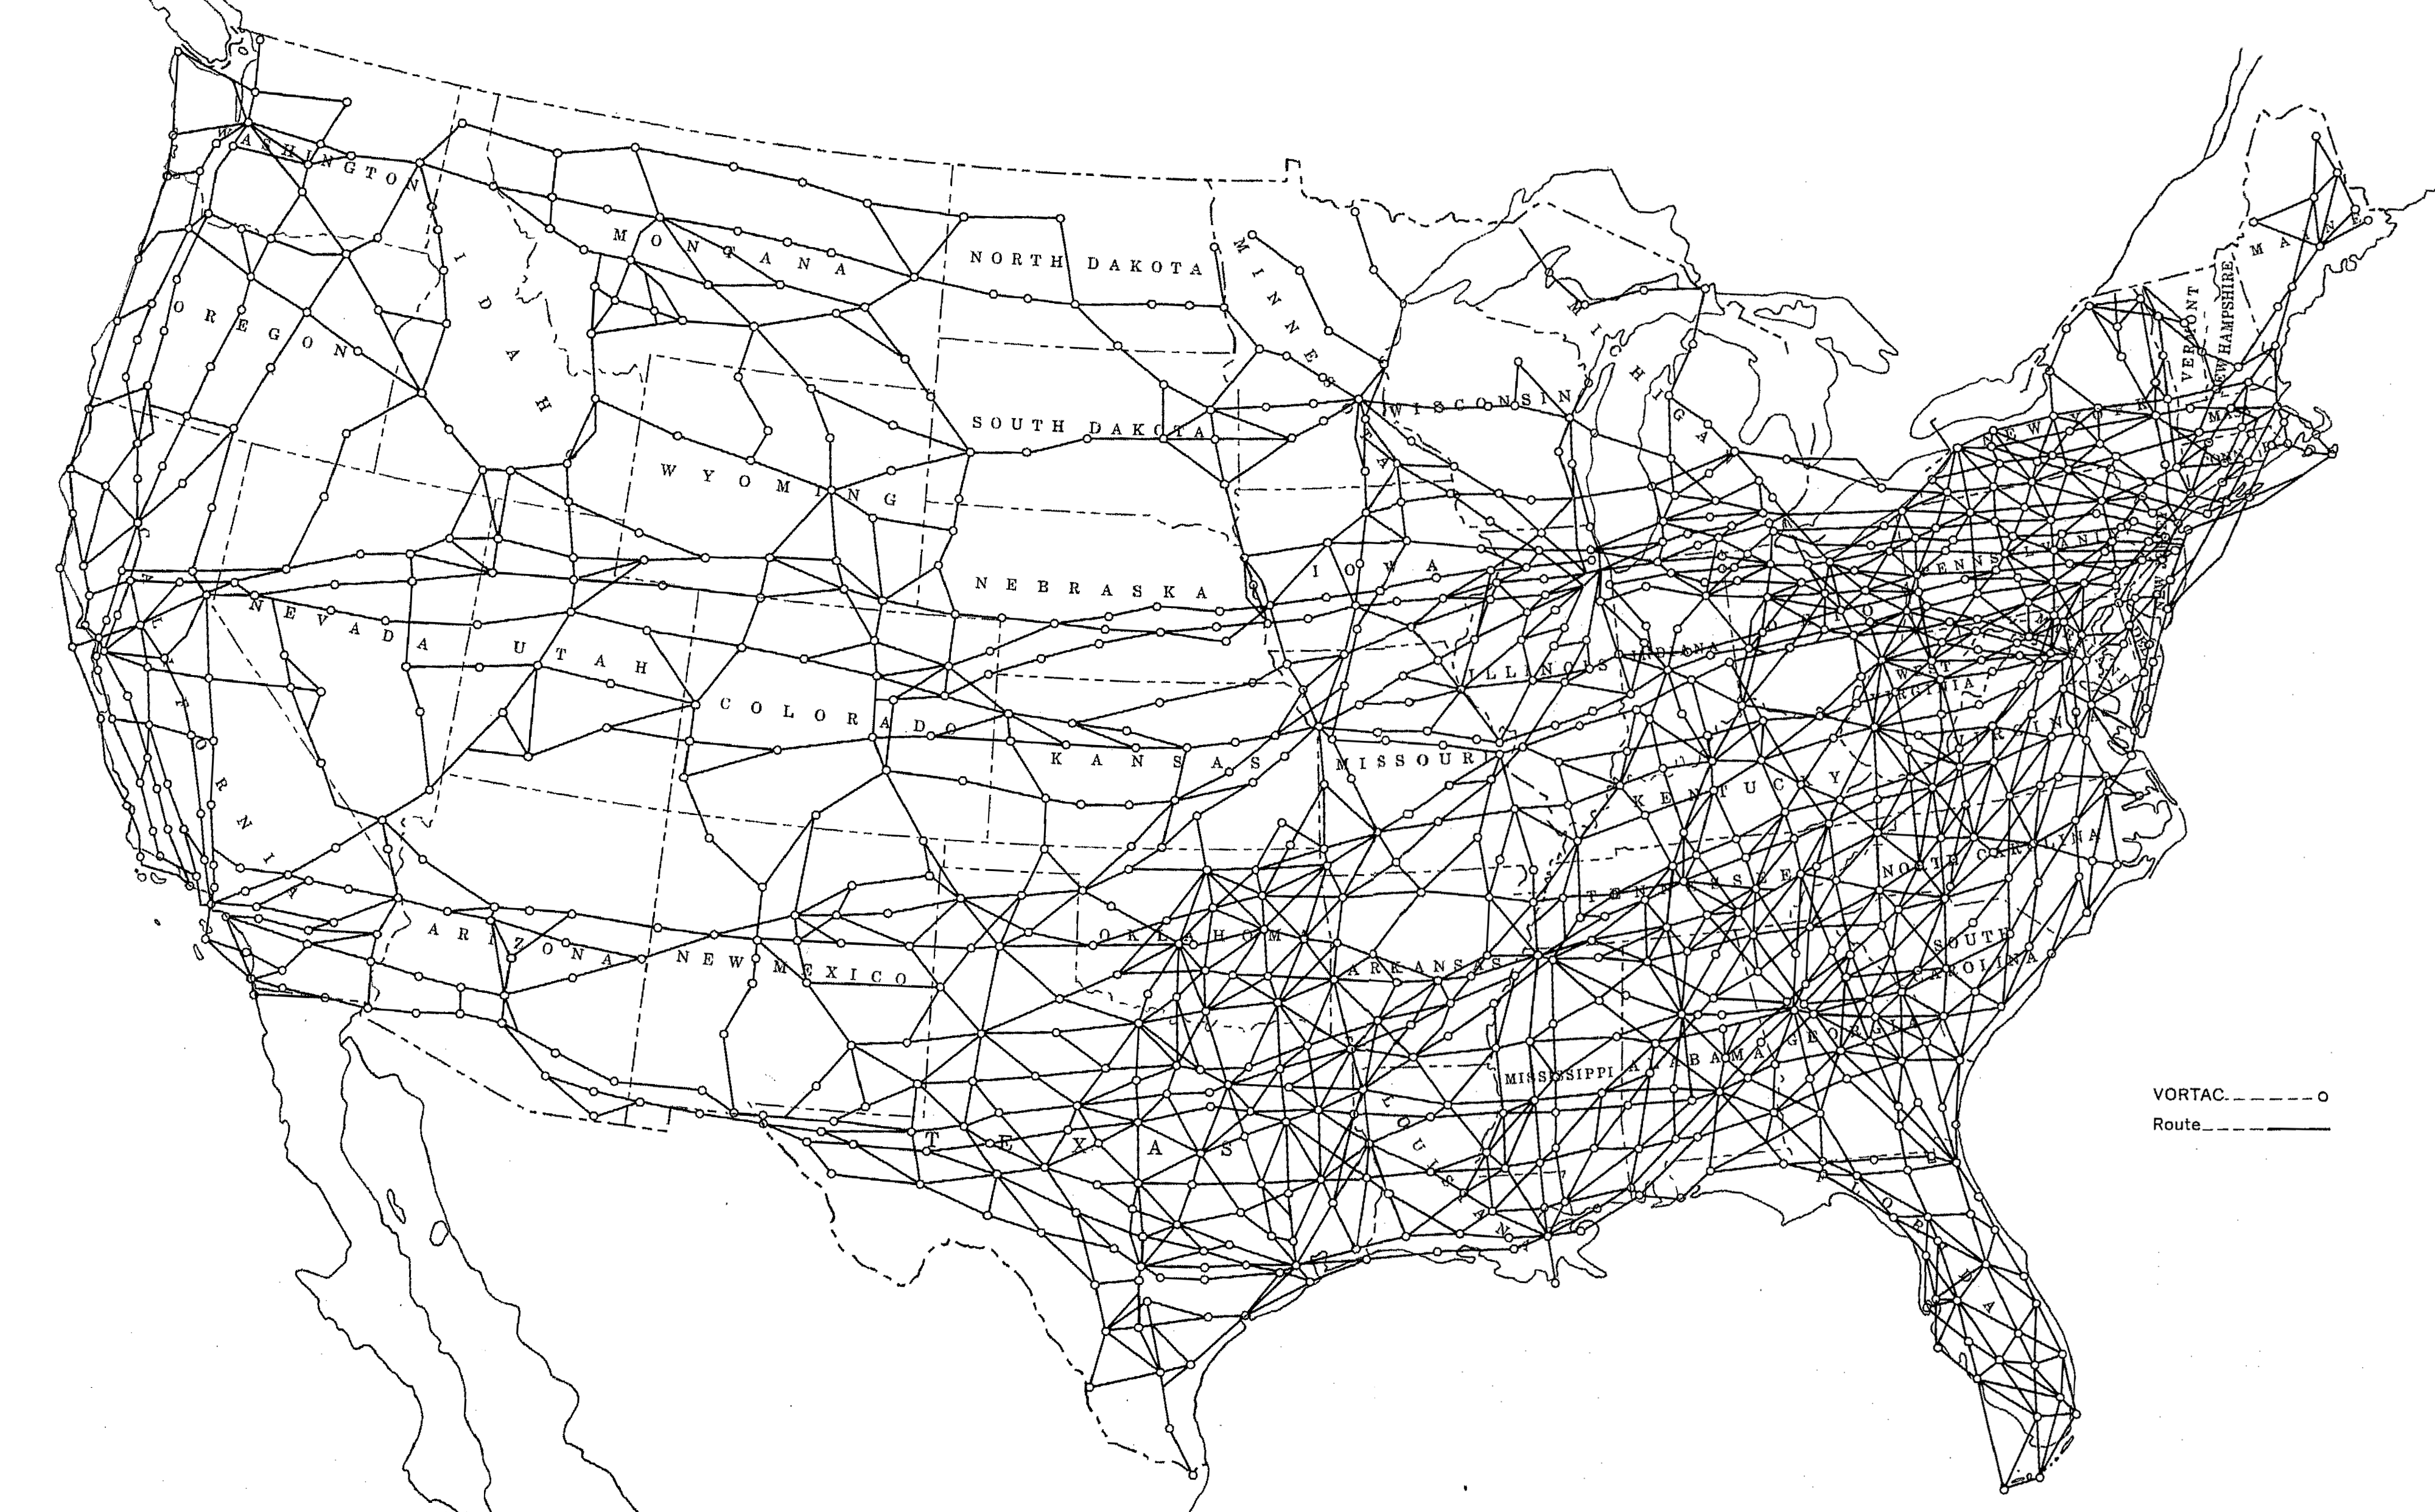
| FIGURE 5.22 |
| 1959 US plan for the VOR/DME airway network through 1965 | |
| from US Air Coordinating Committee Technical Division, “Short Distance Radionavigation: Background Information and Views Presented by the United States of America,” 1958 (ICAO, box “SP/COM/OPS/RAC 1958”), chart 9 Public Domain: US government | |

| FIGURE 5.23 |
| Expansion of Decca coverage, 1946–1985 download transmitter locations and chain connections as GIS layers | |
| William Rankin Creative Commons BY-NC-SA | |
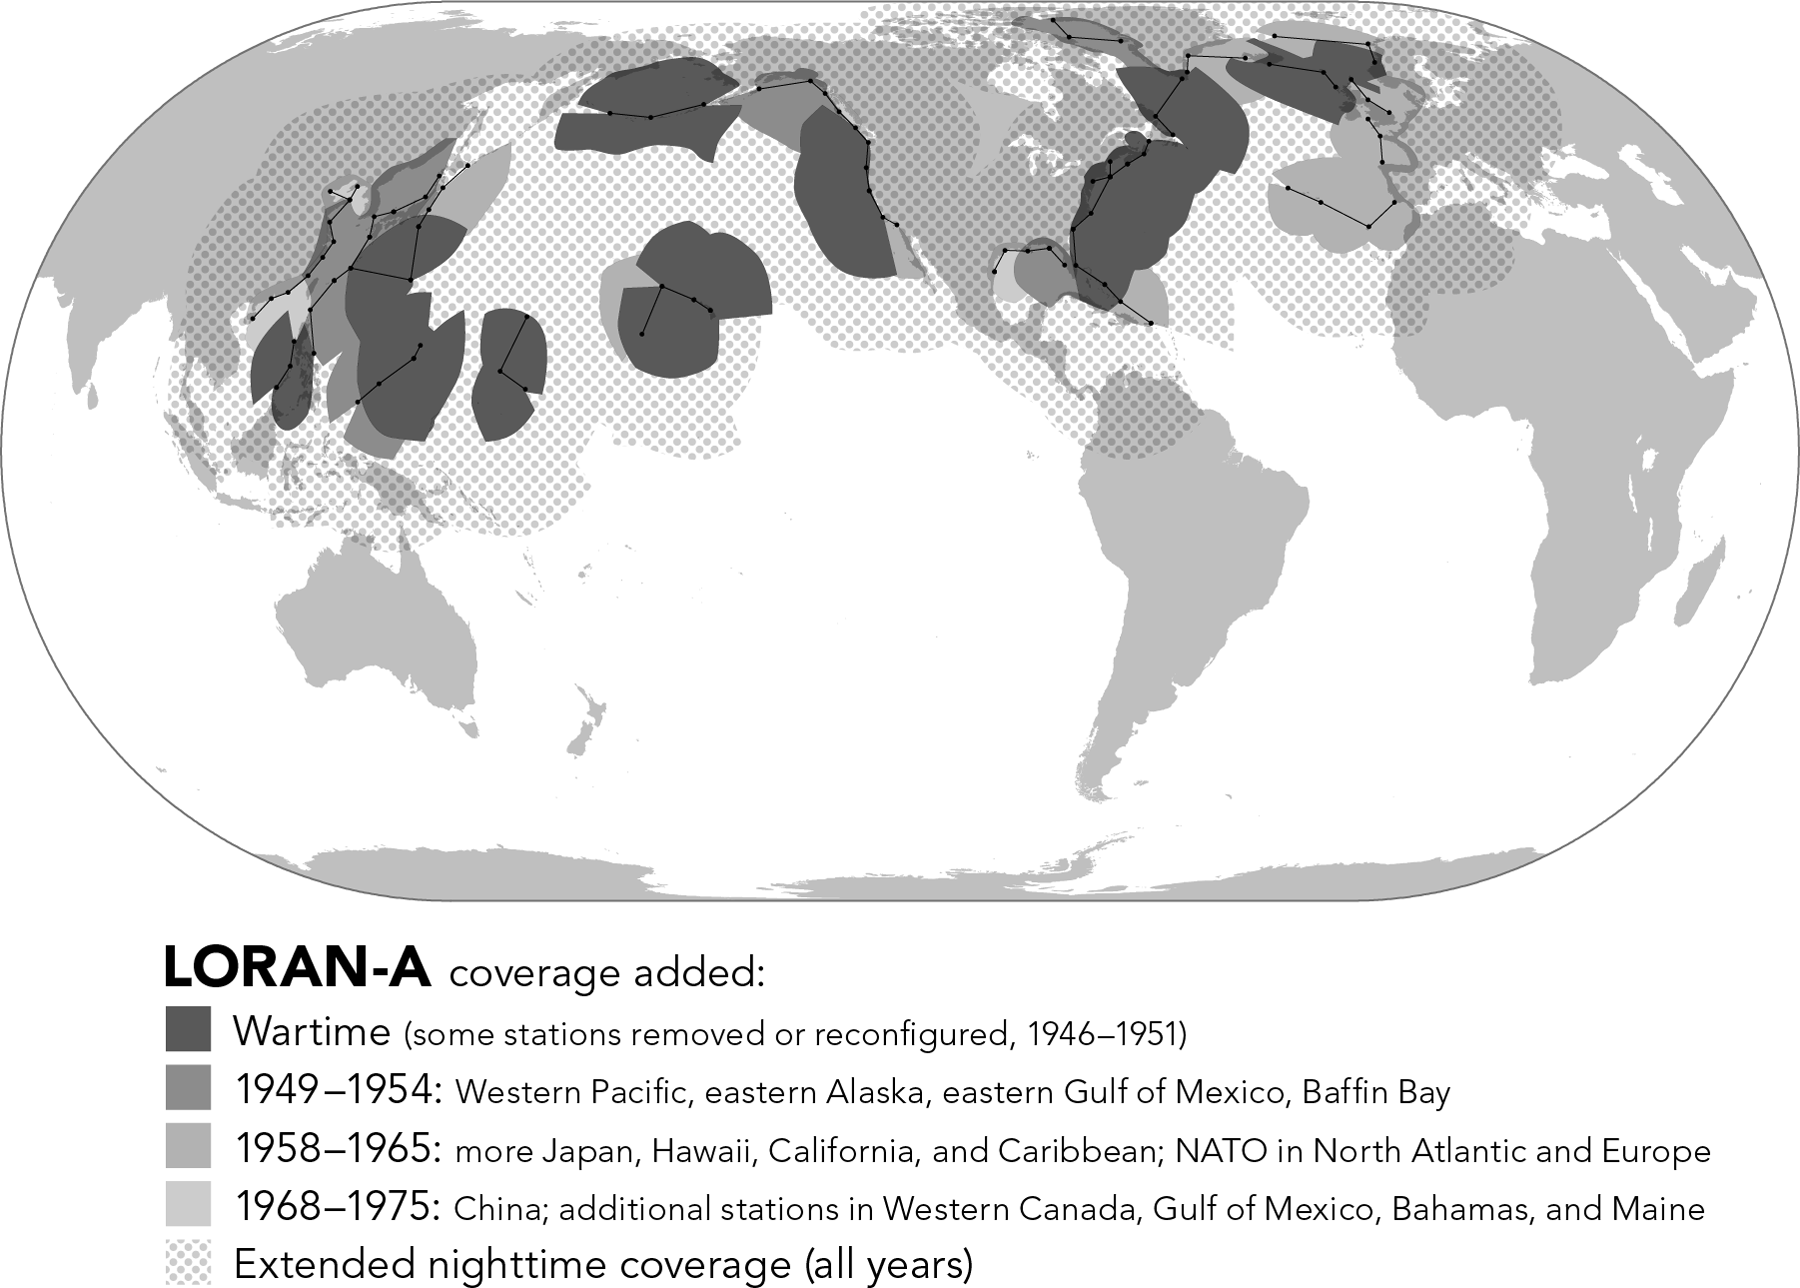
| FIGURE 5.24 |
| Expansion of Loran-A coverage, 1946–1975 download transmitter locations and chain connections as GIS layers | |
| William Rankin Creative Commons BY-NC-SA | |
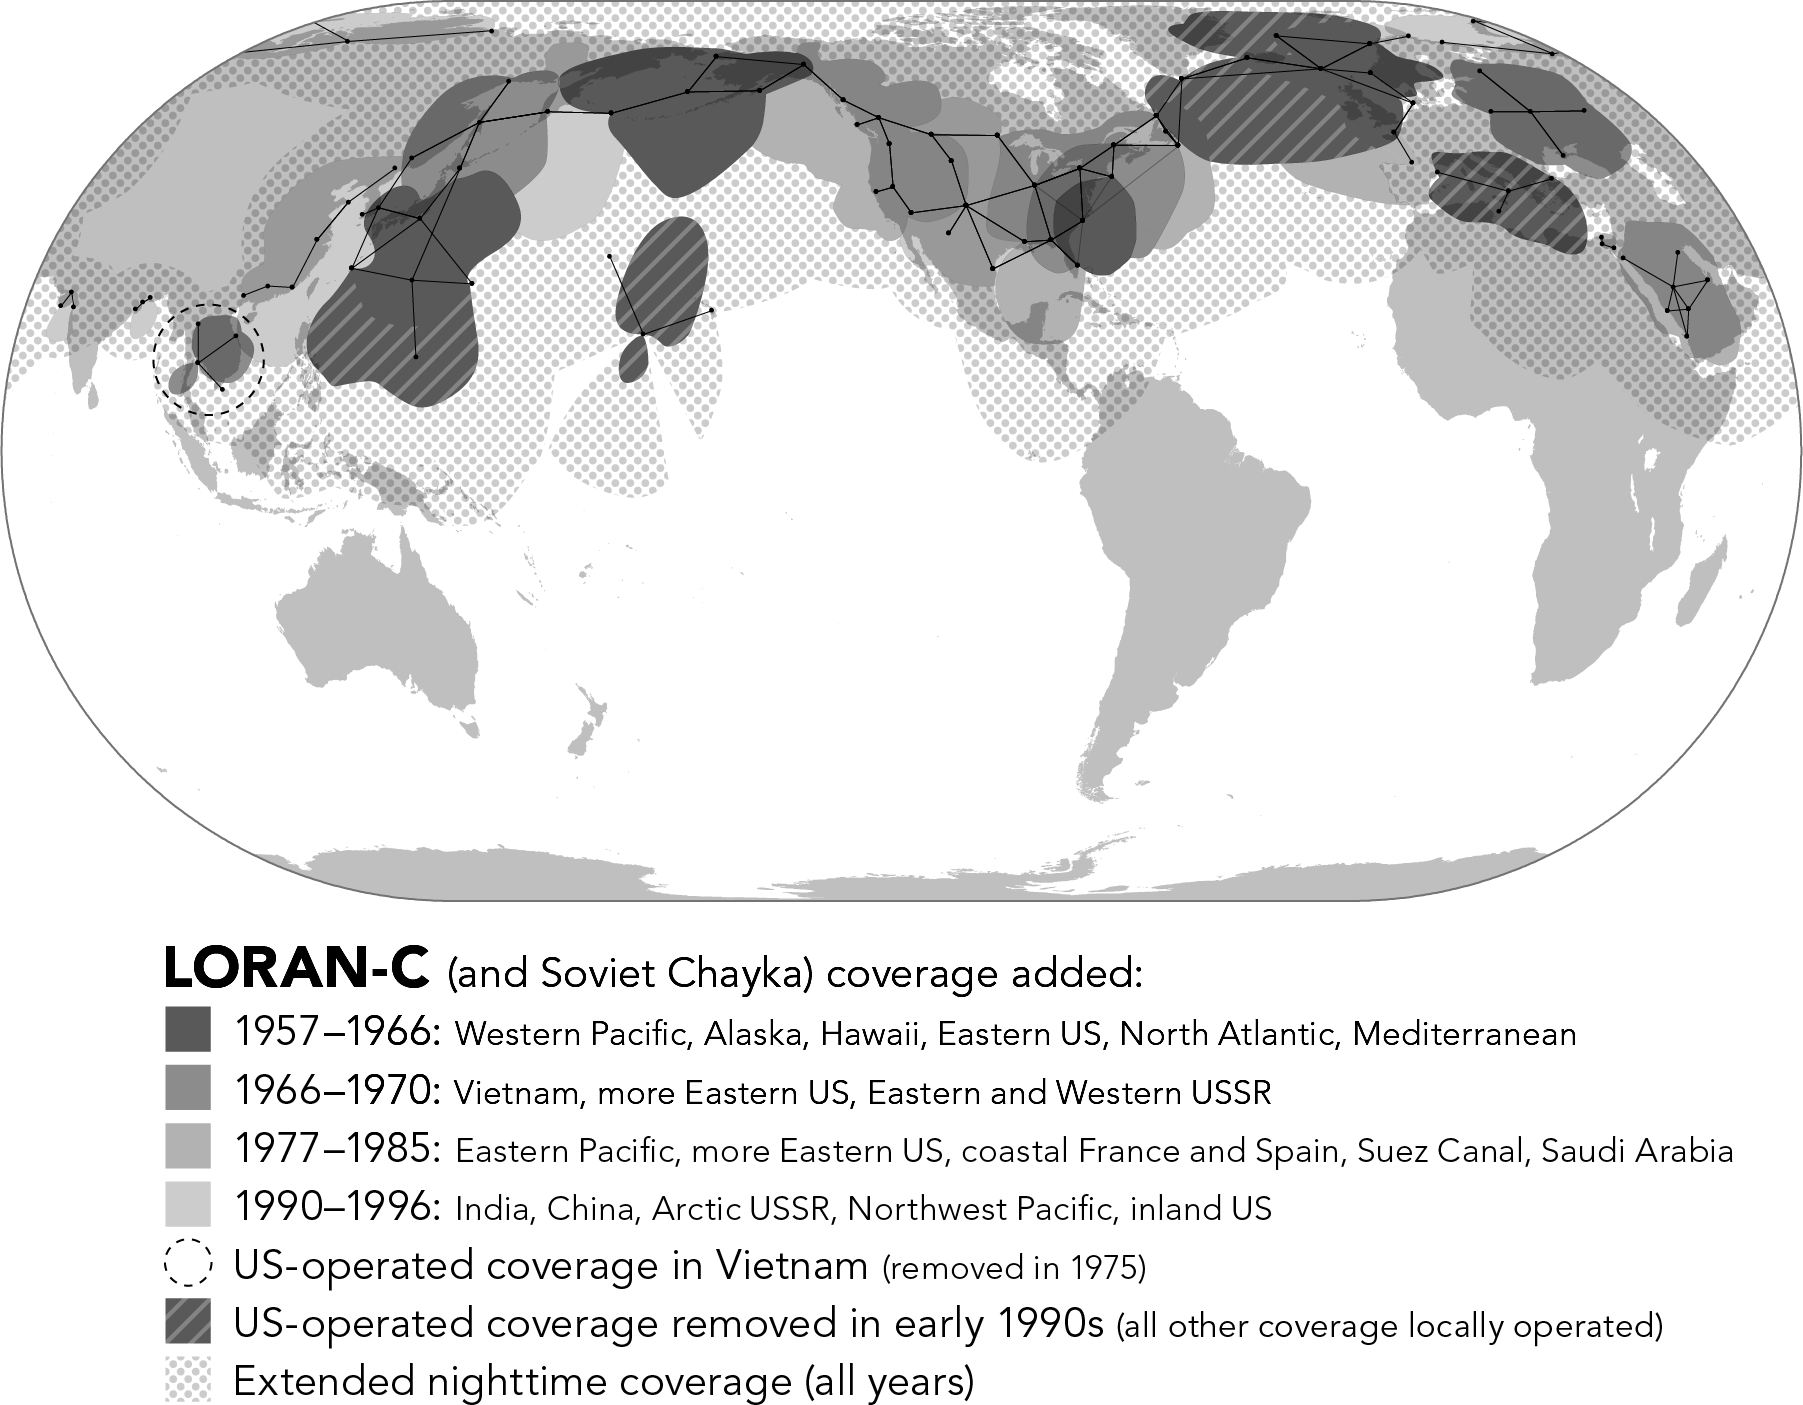
| FIGURE 5.25 |
| Expansion (and contraction) of Loran-C coverage, 1957–1996 download transmitter locations and chain connections as GIS layers | |
| William Rankin Creative Commons BY-NC-SA | |
| FIGURE 5.26 |
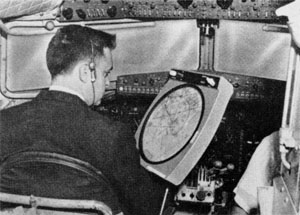
| Integrated map display with a fixed map and a movable "bug" showing the pilot's real-time location (1965) | |
| Navigation (US) Copyright 1965 | |
| FIGURE 5.27 |
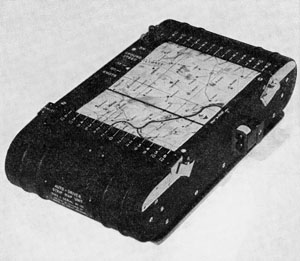
| A palm-sized "roller map" display that would automatically advance as the plane followed its course (1960) | |
| Journal of the Institute of Navigation (UK) Copyright 1960 | |
| continue to chapter 6 . . . | |